Full Report
What this industry sells
The Chinese social-media platform industry sells attention. Users pay nothing; they arrive for content, and the platform rents the resulting audience to businesses that want to be seen. Weibo describes itself as "a leading social media platform in China for people to create, discover and distribute content," and reports 567 million monthly active users and 252 million average daily active users in December 2025 [1]. The economic organizing principle follows from that: content is contributed largely for free by the audience itself and by influencers who want reach, the platform packages the attention into advertising inventory, and third-party agencies broker most of the money.
Three definitions carry the rest of this page. MAU and DAU are monthly and daily active users — the raw supply of attention. KOL means key opinion leader, the Chinese term for an influencer with a monetizable following; MCN means multi-channel network, the agency that manages KOLs at scale. Brand advertising buys awareness and is priced on exposure; performance advertising buys a measurable action and is priced on it. Weibo's filings describe the two as having converged, with demand from both large and small customers "shifting towards branding-plus-performance" [2].
MAU, Dec 2025 (m)
Average DAU, Dec 2025 (m)
Advertisers, FY2025 (m)
Advertising share of revenue
Sources: FY2025 Form 20-F, Business Overview [3] and the Revenues discussion [4].
Advertising and marketing revenues were $1,501.6 million of Weibo's $1,757.2 million total in 2025 — roughly 85 cents of every dollar. Value-added services, mainly membership and game-related services, supplied the remaining $255.6 million [5].
The same revenue-by-line series over FY2016-FY2025 is charted in History.
The value chain and where the money stops
Five stages sit between a post and a paid invoice. The unusual feature of this industry is that the largest cost input in adjacent media businesses — content — is largely donated at the top of the chain, because the people supplying it are paid in audience rather than cash.
Sources: FY2025 Form 20-F — advertising products and pricing [6]; platform partners [7]; creator dependence [8]; agency rebates and KOL revenue share [9]; SINA as sales agent [10]; FY2021 Form 20-F, channel partnership program [11].
Where the profit pool sits is visible in the cost line each player carries. Weibo's cost of revenues was $421.8 million in 2025, 24% of revenue [12]. iQIYI, which buys long-form video, spent RMB15,449.6 million on content alone, 57% of its revenue [13]. Bilibili's revenue-sharing costs, paid to distribution channels, game developers and creators, reached RMB12.1 billion, about 40% of revenue [14]. Hello Group paid RMB5,459.1 million in revenue sharing to broadcasters and talent agencies, 53% of revenue [15]. The distance between a platform whose content arrives free and one that buys or rents it is the largest single determinant of operating margin in this group.
How big the market is, and what the record supports
The corpus contains exactly one third-party sizing of the Chinese advertising market, and it is twelve years old. Weibo's 2014 IPO prospectus cited ZenithOptimedia's Advertising Expenditure Forecasts of September 2013: China was the world's third-largest advertising market at $37.2 billion in 2012, equal to 0.5% of GDP, against $161.2 billion and 1.0% of GDP in the United States. Online marketing had grown from $2.7 billion in 2008 to $7.0 billion in 2012 — 13.1% and 18.8% of total advertising spend — and was forecast to reach $15.9 billion, or 31.6% of the market, by 2015, a three-year compound rate of 31.4% [16].
Source: ZenithOptimedia Advertising Expenditure Forecasts dated September 2013, reproduced in Weibo's April 2014 IPO prospectus; 2012 is actual and 2013 to 2015 are forecasts made in 2013, stated in US dollars [17].
That series is a historical artifact, not a current market size. It establishes the shape of the industry's formative decade — online spend taking share from television at roughly three times the growth rate of total advertising — and nothing about 2026. No annual report, results release or transcript in this corpus contains a current market-size estimate, a market-share figure, or a third-party ranking of Chinese social platforms by advertising revenue. Any statement about Weibo's share of Chinese digital advertising would therefore have to come from outside the primary record, and this page does not make one. What the record does support is a comparison of what the individual listed players report.
The players that matter
Weibo names its competitors directly. As a media business it says major Chinese internet companies such as Tencent and ByteDance "compete directly with us for user traffic and user engagement, content talent and marketing resources." As a social platform it lists three cohorts: messengers such as Weixin/WeChat; multimedia apps "such as Douyin/TikTok, Kuaishou, Bilibili, Xiaohongshu (also known as RedNote), iQiyi, Tencent Video and Youku"; and news apps operated by Tencent and ByteDance [18]. In its advertising risk factor it names one vertical rival outright: "internet companies that offer digital media tailored to specific vertical, such as Autohome" [19].
A limitation sits at the top of that list. The two players Weibo names first — Tencent and ByteDance — have no filings in this corpus, and ByteDance is unlisted. The four peers whose annual reports are indexed are the second tier: Bilibili, iQIYI, Autohome and Hello Group. Each is a genuine competitor for Chinese attention and Chinese marketing budgets, and each monetizes that attention through a different mechanism, so the table below sets them side by side on that basis rather than as like-for-like comparables.
Sources: Weibo FY2025 Form 20-F income statement [20] and Business Overview [21]; Bilibili FY2025 Form 20-F income statement [22], revenue detail [23] and user metrics [24]; iQIYI FY2025 Form 20-F results of operations [25] and revenue detail [26]; Hello Group FY2025 Form 20-F results table [27]; Autohome FY2025 Form 20-F results of operations [28], net revenues [29] and mobile users [30]. Peer figures are translated from RMB at the convenience rate of RMB6.9931 to US$1.00 printed in each peer's own Form 20-F; Bilibili's advertising figure and Hello Group's non-VAS figure are derived from the RMB amounts at that rate.
Four observations follow, none of them a judgment on any share price. Operating margins in this group span 0.8% to 26.5%, and the ranking tracks content cost almost exactly. Revenue direction diverged sharply in 2025: Bilibili grew 13.1% while three of the five shrank. Advertising is not the primary business for two of the five — iQIYI sells subscriptions and Hello Group sells virtual gifts and memberships — so "competitor" there means competitor for user hours, and for advertising budgets only at the margin. And Autohome shows how a vertical specialist absorbs a category shock that a general platform feels only in part: its media services revenue fell 24.3% in 2025 "primarily due to reduced advertising spending by ICE automakers amid shrinking sales volumes in the ICE segment" [31].
Who pays, and who holds the purchasing power
The buyer side has restructured twice over. Until 2020 Weibo split its advertising customers into key accounts, which bought brand exposure, and small and midsize enterprises, which bought performance, and ran two sales forces to serve them. It merged the teams at the end of 2020 and stopped tracking the two groups separately from 2021, because the distinction between their needs "became less obvious" and demand from both had shifted towards branding-plus-performance [32]. The final year on the old basis showed the split plainly: key accounts $741.5 million and SMEs $592.7 million in 2020 [33].
The second restructuring is still running. The number of advertisers has fallen every year since 2019, while the average spend of those who remain has risen more than fivefold.
Sources: FY2021 Form 20-F for 2019 and 2020 [34]; FY2022 Form 20-F for 2021 and 2022 [35]; FY2023 Form 20-F for 2023 [36]; FY2025 Form 20-F for 2024 and 2025 [37].
Weibo attributes the shrinking count to "the churn of advertisers with relatively lower advertising budgets" [38]. The arithmetic is that the long tail of small self-serve advertisers that once defined social monetization in China has largely left this platform, and revenue now rests on a smaller set of larger buyers.
Purchasing power is exercised through agencies. Weibo treats an agency that signs the contract as its customer even though the advertiser is the beneficiary, pays those agencies rebates accounted for as variable consideration, and recognises revenue net of them [39]. The agency share of billings has fallen for three consecutive years.
Sources: FY2022 Form 20-F revenue disaggregation note [40]; FY2025 Form 20-F revenue disaggregation note [41].
Agencies billed 77.7% of advertising revenue in 2022 and 62.8% in 2025. Direct billings have risen every year since 2022 in both share and absolute dollars.
One buyer stands apart. Alibaba is both a related party and Weibo's largest single advertiser; its spend rose 49% to $173.8 million in 2025, 11.6% of advertising revenue, "driven by deeper collaboration between Alibaba and us during key e-commerce marketing windows," and Weibo notes that this spending "highly correlates to its own business operation, especially its marketing strategies, which fluctuates from time to time" [42]. Adding SINA and other related parties, $212.3 million of the 2025 advertising line, or 14.1%, came from related parties [43].
Demand is also concentrating in time. E-commerce platforms are "increasingly concentrating ad budget towards shopping festivals" [44], which deepens the industry's existing seasonality: spending is lowest in the first quarter because of the Lunar New Year holidays, and is further moved by events such as the FIFA World Cup and the Olympic Games [45].
The forces that divide the arena
Sources: FY2025 Form 20-F — competition [46], slowing internet community growth [47], creator dependence [48], agency rebates [49] and RMB receipts [50]; FY2022 Form 20-F, pre-install partner pricing [51]; FY2021 Form 20-F, channel partnership program [52].
The value-added services line shows what happens when one of these forces turns. Weibo's VAS once included live streaming: the Yizhibo business fell from $76.7 million in 2019 to $39.3 million in 2020 on intense market competition [53]. By 2025 the description of the line had narrowed to membership and game-related services [54]. The live-streaming profit pool did not leave the industry — Hello Group still runs an RMB10.2 billion value-added services business built on virtual gifting [55] — it moved to platforms built around it.
The regulatory stack
Regulation here is not a single licence but a stack of content, algorithm and commerce rules that attach to the platform. The recent additions carry hard effective dates.
Sources: FY2025 Form 20-F — microblog provisions and the amended Cyber Security Law [56], advertising regulation [57], algorithm recommendation and generative AI [58], AI labelling and livestreaming e-commerce measures [59]. Rows are ordered by the date the listed obligation takes effect.
The commercial consequence is that liability for what appears on the platform is shared with the platform rather than left with the advertiser. Weibo notes that where regulators find content objectionable they "may require us to limit or eliminate the dissemination or availability of such content or impose penalties, including the revocation of our operating licenses or the suspension or shutdown of our online operations," and that compliance cost rises with content and user volume [60].
Where the cycle sits
Chinese online advertising has run one deep downturn and one shallow, uneven recovery over the past five years. Weibo's advertising revenue grew 47% year on year in the second quarter of 2021 [61]. By the first quarter of 2022 growth was 10%, with management describing the overall advertising market as softening amid macro uncertainty, a resurgence of COVID-19 and lockdown disruptions [62] [63]. By the third quarter of 2022 advertising revenue was $393.4 million, down 27% and down 21% in constant currency, against what management called industry-wide pricing pressure [64] [65]. The twelve quarters since the trough are shown below.
Sources: Weibo quarterly unaudited results releases — 2Q 2023 [66], 3Q 2023 [67], 4Q 2023 [68], 1Q 2024 [69], 2Q 2024 [70], 3Q 2024 [71], 4Q 2024 [72], 1Q 2025 [73], 2Q 2025 [74], 3Q 2025 [75], 4Q 2025 [76], 1Q 2026 [77].
Sources: earnings call transcripts — 2Q 2023 [78], 3Q 2023 [79], 2Q 2024 [80], 3Q 2024 [81] and [82], 4Q 2024 [83], 1Q 2025 [84] and [85], 2Q 2025 [86], 3Q 2025 [87], 4Q 2025 [88], 1Q 2026 [89]; revenue levels from the quarterly results releases cited above.
Three features stand out. The recovery has been shallow rather than a cycle turn: eleven of these twelve quarters printed year-on-year advertising growth between minus 6% and plus 5%. Sector rotation has done most of the work, with automobile and internet services growing through the electric-vehicle transition and food-delivery competition while FMCG, food and beverage, apparel and personal care are repeatedly named as the drag [90] [91]. And currency now runs the other way: the 9% dollar growth reported for the first quarter of 2026 was 3% in constant currency [92], because revenue is received substantially in RMB while the accounts are kept in US dollars [93] [94].
Triangulating across the peers confirms the same macro but not the same outcome. iQIYI's advertising revenue fell 9.1% in 2025 "as some advertisers adjusted their advertising and promotion strategies in response to macro pressure" [95]; Autohome's media services fell 24.3% on internal-combustion vehicle weakness [96]. Bilibili's advertising revenue rose 22.8% [97], and its management described growth accelerating "from 20% year-on-year growth in the first quarter to 27% year-on-year growth in the fourth quarter," adding that "we continue to gain larger share of overall ad budgets" [98]. A flat market in which one player compounds in the twenties is a share shift, not a cycle.
Three currents running through this arena
Attention has stopped growing and is being re-sorted. Weibo's own filing records that with the growth rate of the overall size of the internet community slowing down, "the industry is evolving rapidly while witnessing rising competition for traffic and user time" [99]. At platform level that shows up as a peak and a fade, charted alongside Bilibili's series in Competition.
Bilibili over the same 2025 grew both DAU and MAU 8%, to 112 million and 368 million [100]. Part of Weibo's decline is a deliberate purchase decision: management attributes the sequential fall in the first quarter of 2026 to "ongoing rationalization of channel investment" — buying fewer pre-installed users [101] [102]. The split between users acquired and users retained is one of the few levers a platform in this industry controls directly, and its price is set by handset makers.
The buyer base is consolidating faster than the audience is shrinking. Advertiser count fell from 2.4 million in 2019 to 0.4 million in 2025 while average spend per advertiser rose from $593 to $3,385 [103] [104]. Total advertising revenue was roughly flat across those years, so composition rather than level is what changed. A base carried by fewer, larger buyers is more sensitive to individual budget decisions — Alibaba alone moved Weibo's advertising line by $57 million in 2025 — and correspondingly less exposed to the self-serve long tail that drives volume elsewhere in digital advertising.
AI has entered on three sides at once. As tooling, Weibo says it will "continue to drive the application of AI in ad creative generation and AI placement optimization" for clients of all sizes [105], and is using large language models to rework its recommendation feed and search products [106]. As demand, AI applications have become an advertising category in their own right: Bilibili's fourth-quarter 2025 call fielded a question about AI applications "ramping up their marketing spending recently" [107], and Weibo has flagged AI-application marketing as a reason user acquisition costs rose in the same quarter it was buying fewer pre-installs [108]. As regulation, the labelling measures effective 1 September 2025 and the livestreaming e-commerce measures effective 1 February 2026 make the distributing platform responsible for detecting and labelling AI-generated content, including where the file metadata carries no declaration [109]. The same technology is at once a cost saving, a source of new budget, a bidder against the platform for user attention, and a compliance obligation.
Definitions, comparability and what the record does not say
Three gaps in the record are worth stating plainly. There is no current third-party sizing of the Chinese online advertising market anywhere in this corpus; the only sizing is the 2013 ZenithOptimedia and iResearch data reproduced in the 2014 IPO prospectus, presented above as history. There are no filings for Tencent or ByteDance, the two competitors Weibo names first, so the largest part of the arena is visible only through Weibo's own characterisation of it. And no company in this group discloses advertising pricing, fill rate or ad load, so changes in monetization cannot be decomposed into price and volume from the public record — the closest available proxies are the advertiser count and average spend per advertiser that Weibo does publish.
For how these forces have played out against the named rivals, see Competition; for how Weibo itself reached the present position, see History.
The contested ground
Weibo competes for three different things, against three different sets of rivals, and its own filings separate them. For user traffic and engagement it names Tencent and ByteDance as direct media rivals, plus a list of messaging and multimedia apps — Weixin/WeChat, Douyin/TikTok, Kuaishou, Bilibili, Xiaohongshu (RedNote), iQiyi, Tencent Video and Youku [1]. For advertising and marketing spending it names a shorter, harder list: Tencent, ByteDance, Kuaishou, Baidu, Xiaohongshu, Bilibili and iQiyi, plus vertical-media specialists "such as Autohome" [2]. For value-added services — membership, game-related services and social commerce — it competes with "platforms which provide similar services to users" without naming them [3].
The evidence base for this tab is five Weibo annual reports (FY2021 through FY2025), the 2014 IPO prospectus, sixteen Weibo earnings calls, the quarterly result releases, and the filings and calls of four named rivals that are in this corpus: Bilibili, iQIYI, Autohome and Hello Group. Two of the largest rivals Weibo names — Tencent and Kuaishou — have no filings or transcripts staged here, and ByteDance, Xiaohongshu and Douyin are private and file nothing. Every peer comparison below is therefore drawn from the four filers, and the arena structure and industry-level economics belong to Industry; the raw source shelf is on Competitors.
Sources: FY2025 Form 20-F, Competition [4] and advertising risk factor [5]; FY2021 Form 20-F, Competition, for the Momo reference [6]; corpus inventory for document availability.
The rival roster, 2014 to FY2025
The list of companies Weibo names has turned over almost completely since the IPO. The 2014 prospectus described a portal-era field: Sohu, NetEase, Tencent and Phoenix New Media as direct media rivals, WhatsApp, Line, KakaoTalk, Douban, Momo and renren.com among the social apps, Qihoo 360 as an entry point, and Twitter and Facebook as possible global entrants [7]. Its advertising competitors were "Sohu, Netease, Tencent, Baidu and Youku Tudou" [8]. By FY2025 only Tencent and Baidu survive on that advertising list; the additions are ByteDance, Kuaishou, Xiaohongshu, Bilibili and iQiyi [9].
The recent edits are small but directional. Momo and Qzone left the messaging list after FY2021 [10], QQ Mobile left after FY2023 [11], NetEase left the named news rivals in FY2024 [12], Meituan left the vertical-media clause in the same year, leaving Autohome alone in that clause [13], and Xigua Video left the multimedia list in FY2025 [14]. Autohome is the only company Weibo has named individually as a vertical rival in every year since FY2021 [15] [16].
Sources: 2014 IPO prospectus, Competition [17] [18]; Form 20-F Competition sections and advertising risk factors for FY2021 [19] [20], FY2022 [21] [22], FY2023 [23] [24], FY2024 [25] and FY2025 [26] [27].
Rival numbers, as each company reports them
Weibo reports in U.S. dollars; Bilibili, iQIYI, Autohome and Hello Group all report in renminbi and translate their FY2025 figures at RMB6.9931 to US$1.00, the H.10 rate at December 31, 2025 [28]. The FY2023 and FY2024 renminbi columns below are left unconverted, because no single documented rate applies across all three years. Growth rates and margins are therefore the only strictly like-for-like columns.
Note: the FY2023 to FY2025 columns are in each issuer's own reporting unit; the final column restates FY2025 in U.S. dollars, using each peer's own convenience translation and Weibo's reported figure unchanged. Sources: Weibo FY2025 Form 20-F, Results of Operations [29]; Bilibili FY2025 Form 20-F [30]; iQIYI FY2025 Form 20-F [31]; Hello Group FY2025 Form 20-F [32]; Autohome FY2025 Form 20-F [33].
The advertising lines diverge more sharply than the totals. Bilibili's advertising revenue rose from RMB6,412.0 million in 2023 to RMB8,189.2 million in 2024 and RMB10,058.4 million in 2025 [34] — a 22.8% gain in the most recent year [35]. iQIYI states its own trajectory in its risk factors: online advertising revenue rose 16.7% in 2023, then fell 8.2% in 2024 and 9.1% in 2025 [36]. Autohome's media services revenue — the line that sits closest to Weibo's auto-vertical brand budgets — fell 18.6% in 2024 and a further 24.3% in 2025 [37] [38]. Hello Group is not on the chart: from the first quarter of 2025 it folded live video into value-added services and mobile marketing into "other services", so it no longer discloses a comparable advertising line [39].
Sources: derived from reported revenue lines — Weibo FY2025 Form 20-F Revenues [40] and FY2023 Form 20-F Revenues [41]; Bilibili FY2025 [42] and FY2024 [43] [44]; iQIYI FY2025 risk factor [45]; Autohome FY2025 [46].
The currency split matters when reading that chart. Weibo's reported figures are in dollars while the peers' are in renminbi, and Weibo has quantified the gap: first-quarter 2026 advertising revenue grew 9% as reported and about 3% in renminbi terms [47], and the release attributes the increase "mainly" to "favorable foreign exchange impact on the reported numbers" [48]. In the other direction, the FY2024 filing attributes part of that year's ex-Alibaba decline to renminbi depreciation [49]. The direction of the gap has changed sign across the period.
Margins are currency-neutral, and they order the five companies differently from growth. Weibo runs the highest operating margin of the group in all three years while its revenue is flat; Bilibili crossed from a 22.5% operating loss in 2023 to a 3.7% operating profit in 2025 while growing; iQIYI's margin compressed from 9.4% to 0.9%.
Sources: Weibo FY2025 Form 20-F, Results of Operations [50]; Bilibili FY2025 Form 20-F [51]; iQIYI FY2025 Form 20-F [52]; Autohome FY2025 Form 20-F [53]; Hello Group FY2025 Form 20-F [54].
One structural caveat on comparability: Weibo tells the SEC it has "only one operating segment", because information given to its chief operating decision maker about its two business lines stops at the revenue level and no operating costs or assets are allocated to them [55]. Segment-level margin comparisons against Bilibili's four lines or Autohome's three are therefore not available from the filings.
The advertiser base: fewer buyers, larger tickets
The advertiser count and the spend-per-advertiser series are charted in Industry. The clearest quantitative record of competitive pressure sits in Weibo's own advertiser counts. Management attributes both movements to the same cause in every filing — the churn of the smallest buyers: "the churn of individual customers with relatively lower advertising budgets" in the FY2021 filing [56], "the churn of advertisers with relatively lower advertising budgets" by FY2025 [57].
The Alibaba relationship and the rest of the counterparty split are taught in Industry.
How management's own attribution moved
The dollar decline in ex-Alibaba advertising revenue is roughly similar in 2023, 2024 and 2025, but the stated cause is not. Across four filings the explanation shifts from the pandemic to the exchange rate to competition, and in the FY2025 filing competition stands alone.
Sources: FY2022 Form 20-F Revenues [58]; FY2023 Form 20-F Revenues [59]; FY2025 Form 20-F Revenues for both 2024 and 2025 [60].
The calls add texture the filings do not. In the fourth-quarter 2024 call, management explained the decline in cosmetics and personal-care spending by "big sales from multinational brands and heightened competition among ad platforms in content" [61]. In the first-quarter 2025 call it said "the budget allocated by Tencent and NetEase has been reduced", naming two rivals as advertising customers whose game budgets were shrinking [62]. And in the third-quarter 2025 call it described client feedback that "the bidding for the commercial traffic has become increasingly intense, which pushed their cost upward", alongside a tax change that caps the deductibility of feed advertising spend [63].
User scale: the direction of travel
Weibo's monthly active users peaked at 598 million in December 2023 and were 567 million in December 2025; average daily active users peaked at 260 million in December 2024 and were 252 million a year later. By March 2026 the figures were 562 million and 254 million, with management attributing the sequential monthly decline to "ongoing rationalization of channel investment" and the information-feed rework rather than to disengagement [64].
Sources: Form 20-F user risk factors — FY2021 [65], FY2022 [66], FY2023 [67], FY2024 [68], FY2025 [69].
Bilibili reports the same kind of metric on a different basis — an annual average rather than a December snapshot — so the two series are not directly comparable in level. The direction is comparable. Bilibili's average daily active users rose from 104 million in 2024 to 112 million in 2025 and monthly actives from 341 million to 368 million, both up 8%, with average daily time per user rising from 102 to 108 minutes [70] [71].
Sources: Bilibili FY2025 Form 20-F, users [72] and FY2024 Form 20-F, users [73]; the 2023 figures are the FY2024 report's stated bases for its 6% and 4% growth rates and are therefore approximate.
Autohome and Hello Group publish no comparable platform-wide active-user series in these filings, and iQIYI reports membership rather than users. Cross-platform share of user time is not disclosed by any of the five companies.
What the rivals say
None of the four rivals with filings in this corpus names Weibo as a competitor. Bilibili's advertising competition disclosure refers only to "alternative platforms" [74]; iQIYI's names "micro drama platforms, internet social platforms and short video platforms" as categories [75]; and Autohome's names BitAuto, Dongchedi, Xcar, PCauto, "the automotive channels of major internet portals, such as Sina and Sohu", and "companies engaged in social media business, such as ByteDance and Tencent" [76]. Autohome names SINA, Weibo's controlling shareholder, but not Weibo. The only mentions of Weibo anywhere in the peer documents are regulatory citations in Hello Group's filings to a 2016 notice governing audio and video transmission on "Weibo, WeChat and other internet social networking platforms".
Where rivals do speak to the same budgets Weibo chases, the tone is expansionary. Bilibili's third-quarter 2025 call set out an account-team goal to "achieve over a 90% repurchase rate and keep increasing our share of their spending on Bilibili" [77]. In the first quarter of 2026 — the same quarter in which Weibo's advertising revenue grew about 3% in renminbi terms [78] — Bilibili reported advertising revenue of RMB2.6 billion, up 30% year over year, which it called its "13th consecutive quarter of double-digit growth" [79]. Both companies identify AI advertisers as a new budget pool: Bilibili says "the AI sector is bringing incremental ad budget" [80], and Weibo's first-quarter 2026 growth was "driven by the Internet-based software deployment and AI-related investments" together with local lifestyle and automotive [81].
On the auto vertical the two sides describe the same customer stress from opposite positions. Autohome attributes its 24.3% media-services decline to "reduced advertising spending by ICE automakers amid shrinking sales volumes in the ICE segment" [82], and claims a structural position Weibo does not contest in its own filings: "we are actually the only Internet company with very large scale of the social media deployment in the auto sector" [83]. Weibo, for its part, recorded double-digit growth in the automobile vertical in the first quarter of 2026 [84] while telling analysts that its automotive key accounts "have been experiencing double-digit decrease" in their own sales, that handset makers were absorbing higher memory costs, and that e-commerce advertisers faced a "stressful profitability situation" [85].
Hello Group's record points somewhere else entirely. Its mainland China revenue fell from RMB11,204.0 million in 2023 to RMB8,367.1 million in 2025 while overseas revenue rose from RMB798.3 million to RMB2,000.0 million, taking the overseas share from 6.7% to 19.3% [86]. On the domestic social-entertainment ground it shares with Weibo's value-added services, it is contracting.
Value-added services: a different set of rivals, at different scale
Weibo's value-added services revenue was $255.6 million in 2025, essentially flat against $256.0 million in 2024 after a 13% gain that year [87], then fell 11% year over year in the first quarter of 2026 on weaker game-related revenue [88]. The comparable lines at the two nearest peers are several times larger: Bilibili's value-added services were RMB11,928.3 million, or $1,705.7 million, in 2025 [89], and Hello Group's combined value-added services were RMB10,213.7 million, or about $1,460.5 million [90]. iQIYI's membership services, the subscription line Weibo's membership offering sits nearest to, were RMB16,807.3 million, or $2,403.4 million [91]. Bilibili also discloses 25.3 million premium members as of December 31, 2025, up 12% [92]; Weibo discloses no membership subscriber count.
Sources: Weibo FY2025 Form 20-F Revenues [93]; Bilibili FY2025 Form 20-F [94]; Hello Group FY2025 Form 20-F [95]; iQIYI FY2025 Form 20-F [96]; peer figures use each filing's own convenience translation at RMB6.9931 to US$1.00 [97]. Lines are defined differently by each issuer and are not a like-for-like product comparison.
Switching: what the filings actually disclose
Nothing in this corpus creates a contractual barrier to an advertiser moving budget between these platforms. Weibo states plainly that "as is common in the industry, our advertising and marketing customers do not have long-term commitments with us" [98]. Bilibili uses almost identical language [99] and discloses, in its revenue-recognition note, that "substantially all of the contracts have an original expected duration of one year or less" [100]. iQIYI goes further and quantifies the consequence: "most of our advertising customers are not bound by long-term contracts, they may lessen or discontinue advertising arrangements with us easily without incurring material liabilities" [101].
What does create friction is the channel. Weibo transacts business either directly with customers or through third-party advertising agencies [102], and the agency route carried $942.3 million of its $1,501.6 million of FY2025 advertising revenue [103]. Its top ten agencies contributed 37%, 35% and 32% of total revenues in 2023, 2024 and 2025, with no single customer or agency at 10% or more [104]. iQIYI describes the same structure and its stickiness: agencies "typically have good relationships and maintain long periods of cooperation with the brand advertising customers they represent", so contracts are signed with the agency even where the platform has direct contact with the advertiser [105]. Autohome sits at the opposite end of the concentration spectrum: 96 automakers used its media services in 2025, against 101 in 2024 and 96 in 2023, and its top five automaker customers alone contributed 24.1% of media services revenues [106].
Sources: Weibo FY2025 Form 20-F risk factor [107] and concentration note [108]; Bilibili FY2025 Form 20-F risk factor [109] and revenue note [110]; iQIYI FY2025 Form 20-F risk factor [111]; Autohome FY2025 Form 20-F risk factor [112]; Hello Group FY2025 Form 20-F [113].
Two facts sit in tension in that table and are worth holding together. Contractually, an advertiser can leave Weibo at the end of a campaign at no cost. Behaviourally, the buyers who left were the small ones, and total advertising revenue in dollars ended 2025 about 2% below its 2023 level [114] [115].
Gaps in the record
Three limits on the peer evidence above. Tencent and Kuaishou, two of the rivals Weibo names for both user traffic and advertising budgets, have no filings or transcripts in this corpus, and ByteDance, Douyin and Xiaohongshu are private. No structured peer financial feed loaded for this run, so every peer number above is read from a filing page rather than a data series. And no company in the set discloses market share, share of user time, or share of a named advertiser's budget, so the share question can only be approached through the disclosed revenue and user series, not answered from them.
Sources: corpus inventory and peer staging manifests; Weibo FY2025 Form 20-F Competition for the rival naming [116] [117].
What this record covers
Weibo launched in August 2009 inside SINA, began generating revenue in 2012, and listed on Nasdaq in April 2014 at $17.00 per ADS [1]. The primary record indexed for this report runs from that prospectus through the FY2025 Form 20-F filed 23 April 2026 and the first-quarter 2026 earnings call held 28 May 2026.
Four breaks divide the period. The 2014 carve-out established the ownership structure that still governs the company: SINA holds the Class B control block, Alibaba holds the largest economic minority. 2021 combined the fastest revenue growth in the record with the regulatory rectification campaigns, the Hong Kong secondary listing, and SINA's own privatization. 2022 reset revenue to a level it has not left since. From 2023 onward the company redirected cash toward dividends and toward assets bought from its controlling shareholder.
The corpus is uneven across those breaks. Annual reports cover FY2021 through FY2025; the 2014 prospectus and its registration amendments cover the founding period; the six years in between are represented only by figures repeated in later filings. Sixteen earnings-call transcripts are indexed, the oldest for the second quarter of 2021. Two of them — the fourth-quarter 2023 and fourth-quarter 2025 calls — carry no transcript text in this corpus, only the earnings-page metadata around it, and no transcript of the fourth-quarter 2021 call is indexed at all. Those gaps are marked where they bite.
The arc in dated beats
Sources: IPO prospectus, Prospectus Summary, The Offering and Use of Proceeds [2] [3] [4]; FY2021 Form 20-F, related-party and acquisition notes and the Yizhibo live streaming revenue decline [5] [6] [7]; FY2022 Form 20-F, the March 2022 share repurchase authorisation and property [8] [9]; FY2025 Form 20-F, dividend policy, term and revolving facilities, anti-monopoly and ownership [10] [11] [12] [13] [14].
Revenue: one step up, one step down, then a plateau
The prospectus recorded revenue of $65.9 million in 2012 and $188.3 million in 2013, against a 2013 net loss of $38.1 million [15]. Revenue then multiplied roughly nine times in five years, peaked at $2.26 billion in FY2021, fell 18.6% in FY2022, and has since moved less than one percent in either direction for three consecutive years: down 4.2% in FY2023, down 0.3% in FY2024, up 0.1% in FY2025.
Source: reported revenue by business line, FY2016 to FY2025, as presented in the FY2025 Form 20-F consolidated statements of comprehensive income and in the segment disclosures of the earlier Forms 20-F that cover FY2016 to FY2020; FY2023 and FY2022 line detail also appears in the FY2023 results announcement [16].
Inside that plateau, one customer accounts for the direction of travel. Advertising revenue from Alibaba was $139.6 million in 2021, $107.0 million in 2022, $111.6 million in 2023, $116.8 million in 2024 and $173.8 million in 2025 [17] [18]. Advertising revenue excluding Alibaba has fallen in each of the last four years: $1.49 billion in 2022, $1.42 billion in 2023 [19], $1.38 billion in 2024 and $1.33 billion in 2025 [20]. In FY2025 the Alibaba line rose about $57 million and the rest of the advertising book fell about $55 million.
Sources: Alibaba advertiser revenue from the related-party notes [21] [22]; the remainder derived by subtracting that figure from reported advertising revenue. The 2021 Alibaba figure excludes a further $41.7 million billed through an Alibaba advertising agency subsidiary, a channel that ended in 2023 [23].
Users: the series and the sentence attached to it
The December MAU and DAU series is charted in Competition. Weibo reported 129.1 million monthly active users in December 2013 and 61.4 million average daily users [24]; by December 2020 those figures were 521 million MAUs and 225 million average DAUs [25]. MAUs peaked at 598 million in December 2023 and have declined in each of the two years since, to 590 million and then 567 million; daily users peaked at 260 million in December 2024 and stood at 252 million a year later [26] [27].
The explanatory clause attached to the decline has not changed. The FY2024 report says MAUs "decreased slightly to 590 million in December 2024, as we have proactively adjusted our user strategy to focus on the acquisition and engagement of high quality users" [28]. The FY2025 report carries the same clause forward for a decline more than twice as large [29]. On the May 2026 call the CFO gave a more specific version: the sequential fall was "mainly reflecting our ongoing rationalization of channel investment and the transition forming our information feed revamp" [30].
Guidance and outcomes
Weibo issued formal quarterly revenue guidance in the older part of this record and then stopped. On the August 2021 call the CFO said: "We anticipate our third quarter of 2021 revenues to increase by 20% to 25% year-over-year on a constant currency basis" [31]. The November 2021 call gave the same format for the quarter after that: "We anticipate our fourth quarter of 2021 revenues to increase by 15% to 20% year-over-year on a constant-currency basis" [32]. That is the last numeric revenue guidance in this record. None appears anywhere in the twelve usable transcripts from the first-quarter 2022 call onward, and no transcript of the intervening fourth-quarter 2021 call is indexed, so the corpus cannot date the change more precisely than "between November 2021 and May 2022." What management does put on the record instead is directional and operating: margin priorities, user strategy, capital-allocation principles, and named headwinds for the coming quarter.
Sources: IPO prospectus, Dividend Policy [33]; Q2 2021 call [34] [35]; Q3 2021 call [36]; Q1 2022 call [37]; FY2022 share repurchase spend [38]; Q2 2023 results announcement [39]; Q2 2024 call [40]; Q4 2024 call [41] [42]; Q2 2025 call [43]; Q3 2025 and Q4 2025 results announcements [44] [45]; Q1 2026 call and results announcement [46] [47]; FY2025 operating cash flow from the FY2025 Form 20-F liquidity discussion [48]; FY2021 and FY2022 operating margins computed from reported income from operations and net revenues; half-year revenue figures derived by summing reported quarters.
The margin claim made in March 2025 is worth stating precisely because it is both accurate and dated. Non-GAAP operating margin was 33% in FY2022 and 34% in FY2023 [49], and 33% in FY2024 [50]. It was 21% in the fourth quarter of 2025 [51] and 30% for the full year [52].
Source: quarterly results announcements, Q2 2023 through Q1 2026 [53] [54] [55].
Capital allocation
The pattern divides at 2023. Before it, the largest single use of cash was long-term investment: $1,593.9 million paid out in 2021 alone, against $447.4 million of disposals and refunds in the same year [56]. After it, the largest recurring use is the dividend, at roughly $200 million a year for three years and $150 million declared for FY2025.
Sources: investing and financing narratives in the FY2023, FY2024 and FY2025 Forms 20-F [57] [58] [59]; buyback from the FY2022 share repurchase spend [60]; dividends from the dividend policy disclosure [61]. Prepayments for SINA Plaza of $132.5m in 2021 and $153.6m in 2022 sit outside these lines; the 2023 acquisition figure is the $218.4m settlement of that purchase plus other consideration.
Sources: IPO use of proceeds [62]; FY2021 Form 20-F acquisition and related-party notes [63] [64] [65]; FY2022 Form 20-F on Yizhibo, SINA Plaza, the JM Tech performance conditions, the share repurchase spend and impairments [66] [67] [68] [69] [70]; FY2024 Form 20-F impairments and Item 16E [71] [72]; FY2025 Form 20-F on INMYSHOW, investments, debt, dividends, HK proceeds and the new authorisation [73] [74] [75] [76] [77] [78].
Two of those rows describe money moving between Weibo and its controlling shareholder in the same eighteen months: $218.4 million for the building that houses its principal operations, settled in the first quarter of 2023, and RMB2.16 billion for the INMYSHOW stake in March 2023 [79] [80]. Because both parties were under SINA's common control, the INMYSHOW shares came onto Weibo's balance sheet at SINA's carrying value of $230.8 million and the gap between that and the cash paid was recorded in additional paid-in capital as a distribution rather than as an asset [81].
The related-party ledger
Weibo has also run a rolling loan book to SINA throughout the period. In 2025 SINA drew $753.0 million and repaid $773.5 million; the year-end balance of loans and interest receivable was $401.9 million [82]. The disclosed annual interest rate on the balances outstanding at the end of 2022 and 2023 ranged from 1% to 4%, with maturity within one year [83].
Sources: FY2022 Form 20-F for the 2021 balance [84]; FY2023 Form 20-F for 2021 to 2023 [85]; FY2025 Form 20-F for 2023 to 2025 [86]. Interest income on the SINA loans is disclosed in the Item 7 related-party discussions [87] [88] [89].
Two later beats attach to the same block of shares. On 13 March 2025 SINA pledged half its Class B holding — 17.9% of Weibo's shares and 31.3% of its voting power — to secure a $150 million facility, and the filing states that a default could allow the security agent to sell or foreclose, "which potentially could cause a change in control in our company" [90]. In December 2025 Weibo disclosed that SINA had received an adverse judgment in a Cayman Islands section 238 appraisal proceeding arising from its own 2021 privatization; the judgment is stayed pending appeal [91], and a special committee of Weibo's independent directors is monitoring it [92].
Definition and disclosure changes
Sources: segment policy notes in the FY2023 and FY2024 Forms 20-F [93] [94]; results announcements for Q2 2023 and Q4 2023 [95] [96]; the Q4 2025 constant currency footnote [97]; dividend policy disclosure [98].
None of these changes restated a prior period. The segment change is the one that removes information: the two business lines are still disclosed at the revenue level, but the filing states plainly that costs and assets are not allocated to them and that management does not use such information to allocate resources [99].
How the explanation changed
The reason offered for soft advertising revenue has moved through five distinct framings in five years, each anchored to the quarter in which it was given.
August 2021, on the rectification campaigns: management expected "that such rectification may impact on our launch spring campaigns of certain performance driven customers," while adding that "such impact on our overall advertising revenue is manageable" [100].
December 2022, with revenue down 25% year over year: "with macro economy and consumption weighing on the overall advertising market, our clients remained cautious towards their advertising budget spend" [101].
November 2023, the framing shifts to the base period: "in Q3 last year after the pandemic lockdown, advertisers have been intensively launching new products and increased ad placements. Due to these factors, our ad revenues in Q3 picked up modestly year-over-year" [102].
August 2024, back to the economy: "we remain very much cautious over the outlook for the rest of the 2024. So, still we will be experiencing some of the challenges terms of the resumption of the consumption" [103].
August and November 2025, to a specific event comparison: the third quarter would face "a tough year-over-year comparison in third quarter due to the Summer Olympics in the prior year" [104], and the eventual 6% advertising decline was attributed to "less advertising revenue contribution from those sectors which largely benefited from the Paris Olympic Games in the same period last year" [105].
The margin account moved in the opposite direction across the same period. In May 2022 the CFO said Weibo "expect a decline in operating margin compared to last year" and named cost optimisation as the year's highest priority [106]. In March 2025 the same officer described three years of stable non-GAAP margin and around $600 million of operating cash flow as the platform for investing in AI, product innovation and shareholder returns [107]. By May 2026 the framing had returned to spending: costs rose 13%, non-GAAP operating margin fell to 28% from 33%, and the commitment on record is to "manage the pace of these investments with ROI discipline and within a controllable budget framework" [108].
One passage has barely changed. Every annual report from FY2021 to FY2025 illustrates content-regulation risk with the same six-year-old example: the June 2020 CAC fine of RMB500,000 and the one-week suspension of the hot search feature [109] [110]. The FY2025 report is the first to set a current instance beside it: a RMB100,000 fine in September 2025 for displaying a large number of celebrity-related hype topics on the hot search list, with rectification completed [111]. The competitive backdrop against which these explanations were offered is covered in Competition; the people who gave them, and the incentives they hold today, in People.
Where the record is thin
Three gaps limit what this tab can settle. Earnings-call coverage begins with the second quarter of 2021, so the entire 2014 to 2020 stretch of said-versus-did — including the original monetization ramp and the 2018 Yizhibo acquisition — is represented only by figures restated in later filings. The fourth-quarter 2023 and fourth-quarter 2025 call transcripts in this corpus carry no transcript text, which removes both full-year wrap-up calls from the ledger; the fourth-quarter 2025 results announcement covers the numbers but not the question and answer session. And no transcript of the fourth-quarter 2021 call is indexed, so the quarter in which Weibo stopped issuing numeric revenue guidance can only be bracketed between the November 2021 call, which still gave it, and the May 2022 call, which did not.
Three disclosed items have no disclosed outcome. The consideration Weibo received when it transferred the Yizhibo operation to a related party in June 2022 is not stated [112]. Neither the RMB2.16 billion INMYSHOW purchase nor the $127.0 million 2024 investment in a financial-information media company carries any subsequent return disclosure [113] [114]. And the $500 million repurchase authorisation of March 2022 lapsed with 88% unspent, with no explanation offered in any filing or call in this corpus [115] [116].
Who controls Weibo
Weibo is a controlled subsidiary of SINA Corporation, and SINA is a private company controlled by Weibo's own chairman. As of March 31, 2026, SINA held 87,822,024 Class B ordinary shares — 35.7% of the economics and 62.5% of the votes [1]. Class B carries three votes per share; Class A carries one, and Class A can never convert into Class B [2]. SINA in turn is a wholly owned subsidiary of Sina Group Holding Company Limited, itself wholly owned by New Wave MMXV Limited, a British Virgin Islands company owned 61.2% by Charles Chao and 30.0% by Yunli Liu, with the balance held by senior managers of SINA and Weibo including Hong Du and Gaofei Wang. Every voting share in New Wave is held by Chao; the rest are non-voting [3].
The second block is Alibaba. Ali WB Investment Holding Limited holds 67,883,086 Class A shares — 27.6% of the economics but only 16.1% of the votes [4]. Alibaba invested $585.8 million in April 2013 for the original stake behind that position [5], and holds board-appointment rights under a 2014 voting agreement with SINA [6].
SINA voting power
SINA economics
Ali WB voting power
Directors and officers, ex-SINA block
Source: FY2025 Form 20-F, Item 6.E Share Ownership, beneficial ownership table as of March 31, 2026 [7]; insiders ex-SINA derived as 4,403,623 Class A shares over 245,672,572 shares outstanding.
Votes against economics
Source: FY2025 Form 20-F, Item 6.E Share Ownership [8]; class voting rights per Item 6.E notes [9]. "All other Class A" is the residual and is derived.
Chao's personal economic exposure is much smaller than his control. He holds 545,510 Class A shares in ADS form outright, plus 375,000 shares issuable on options exercisable within 60 days [10] — about 0.4% of the company. Looking through New Wave, his indirect interest in Weibo is roughly 22% of the economics (61.2% of New Wave applied to SINA's 35.7% stake), against 62.5% of the votes he directs. Excluding the SINA block, every director and executive officer combined holds 4,403,623 Class A shares, or 1.8% [11].
Insider ownership therefore reads two different ways depending on the test. On the operators' own stakes it is thin: CEO Gaofei Wang holds 1,504,127 Class A shares (0.6%), director Hong Du 939,726 (0.4%), CFO Fei Cao 206,501 (under 0.1%), and Alibaba's board appointee Bo Liu none at all [12]. On control it is absolute: one person directs 62.5% of the votes.
Five years of drift
The Class B block has shrunk twice, and only one of the two reductions is explained. In the December 2021 Hong Kong secondary listing, SINA sold 6,953,620 Class A shares converted from Class B — including 1,453,620 on the over-allotment exercised in January 2022, which took the Class B count from 96,278,958 at December 31, 2021 [13] down to 94,825,338 — and received all the proceeds itself [14]. Class B outstanding then sat at 94,825,338 from January 2022 through December 31, 2022 [15] [16]. By March 31, 2023 it was 87,822,024, where it has stayed ever since [17]. A further 7,003,314 Class B shares therefore left SINA's hands in the first quarter of 2023 — Class B converts automatically to Class A on any transfer away from the Founder [18] — and no annual report explains it. The figure sits just above the 7,000,000-share allowance that Ali WB's right of first offer exempts from its consent [19]. Since then the decline in percentage terms is arithmetic: new Class A shares issued under the incentive plans dilute the ratio while the Class B count stays fixed.
Sources: FY2021 20-F Item 6.E [20]; FY2022 20-F [21]; FY2023 20-F [22]; FY2024 20-F [23]; FY2025 20-F [24].
Ali WB's holding has not moved at all. The 67,883,086 shares disclosed in the FY2025 filing are the same number reported in Ali WB's Schedule 13D of September 9, 2016 — the company sources the figure from that filing rather than from anything more recent [25].
What a minority holder can and cannot do
Weibo uses two stacked sets of exemptions. As a controlled company under Nasdaq rules — SINA holds more than 50% of the votes — it does not have to have director nominees selected solely by independent directors, and does not have to maintain a nominating and corporate governance committee. As a foreign private issuer it additionally opts out of the majority-independent-board requirement, the three-member audit committee requirement, and the requirement for shareholder approval before establishing or materially amending an equity compensation plan [26]. The filing states plainly that the company "will not voluntarily meet these requirements" [27].
Foreign-private-issuer status also removes the Exchange Act sections that require insiders to file public reports of their stock ownership and trading, the proxy solicitation rules, and Regulation FD [28].
Sources: FY2025 Form 20-F, Item 16G corporate governance exemptions [29]; dual-class risk factor [30]; general meeting quorum [31]; EGM requisition right [32]; ADS discretionary proxy [33].
One structural protection sits inside the articles. Class B shares convert automatically and immediately into Class A on any transfer to a person who is not the Founder or a Founder's Affiliate, and on any change of control of a Class B holder or of the SINA parent companies — including a joint-control arrangement, even one in which Chao retains a share of control. All Class B also converts if SINA and its affiliates fall below 5% of the issued Class B [34]. The super-voting right is therefore tied to Chao personally, not to the SINA corporate shell.
Alibaba's contractual rights
Ali WB's rights survive from the 2013 investment and the 2014 amended shareholders' agreement. It may appoint directors in proportion to its ownership, with at least one and never more than SINA's count while it holds fewer shares than SINA; the rights lapse if more than 50% of its acquired shares leave Alibaba's hands [35]. It holds a right of first offer over any SINA sale beyond a 7,000,000-share free allowance, and over management shareholders' sales beyond 20% of their April 2013 holdings [36]. Both SINA and Ali WB hold two demand registrations, unlimited piggyback rights and shelf registration rights, with Weibo paying the expenses [37]. Ali WB's veto over changes to the incentive plans expired in April 2019 [38].
The pledge and the appraisal judgment
Two dated facts sit on top of the control structure, and both concern SINA rather than Weibo.
On March 13, 2025 SINA pledged half of the Class B shares it then held — 17.9% of Weibo's shares and 31.3% of its voting power — to the security agent of a January 2025 facility of up to $150 million maturing March 13, 2028. On default the security agent may sell or foreclose on the pledged shares, which the company states could cause a change in control of Weibo [39].
The encumbrance is smaller than it was. Under the March 2023 facility of up to $300 million, SINA pledged all of the shares it held in Weibo [40]. The January 2025 facility refinanced that arrangement in full — the 2023 facility was repaid and discharged on March 13, 2025 — and the replacement pledge covers half the block rather than all of it, and SINA may pledge further Class B shares from time to time under the same pledge terms [41] [42]. If the pledge is enforced, SINA stops being the controlling shareholder and its Class B shares convert to Class A; a subsequent 50%-plus holder other than a permitted holder would trigger a fundamental change under the 2030 convertible notes, giving holders a repurchase right [43].
Separately, in December 2025 Weibo became aware that SINA had received an adverse judgment in a Section 238 appraisal proceeding under the Cayman Islands Companies Act, arising from SINA's own 2021 privatization. SINA has appealed to the Cayman Islands Court of Appeal, which stayed enforcement pending the appeal. Weibo's board has formed a special committee of independent directors to monitor the case and assess the impact on the shareholding and on the transactions between the two companies, and the outcome is described as uncertain [44]. That is the only special committee Weibo has disclosed, and it is a monitoring body rather than a negotiating one.
The board
Seven directors, three designated independent. The board has been seven for five consecutive years, from the FY2021 filing [45] to the FY2025 one [46].
Sources: FY2025 Form 20-F, Item 6.A directors and senior management table [47]; biographies of Charles Chao through Gaofei Wang [48] and of Yan Wang through Zenghui Cao [49]; the audit committee [50] and the compensation committee [51] per Item 6.C and the FY2025 ESG report board table [52]. Director-since years are as disclosed in the 20-F biographies.
The affiliation column carries most of the information. Two directors are executive officers of SINA and one is an executive officer of Alibaba; the filing states these relationships "could create, or appear to create, conflicts of interest," and that Bo Liu was appointed under the Ali WB shareholders' agreement [53]. Of the three directors designated independent under Nasdaq rules, two have SINA histories: Pehong Chen was a SINA director from 1999 to 2015, and Yan Wang co-founded SINA and served as its CEO and chairman before becoming a SINA independent director until March 2021 [54] [55]. The designation is the exchange's independence test, which looks at employment and compensation relationships with the issuer; it does not test prior service at the controlling shareholder.
Committee structure is thin by design. The audit committee has two members, using the Cayman Islands home-country exemption to sit below Nasdaq's three-member floor, with Lu as chair and designated financial expert [56]. The compensation committee also has two members, chaired by Chen, and the CEO may not be present when his own pay is deliberated [57]. There is no nominating committee.
The 20-F describes two committees; the FY2025 ESG report, published five days later, describes three — audit, compensation and an ESG committee staffed by Yan Wang and Hong Du — and states that independent-director pay is escalated to the full board [58] [59]. The ESG report is also the only place the board's working cadence appears: average director tenure of 8.43 years, one annual general meeting, four in-person board meetings with 100% attendance, and three written resolutions during 2025 [60].
Directors retire by rotation — one-third at each annual general meeting, longest-serving first — and any director can be removed by ordinary resolution, or by written notice signed by three-quarters of the other directors [61]. Board composition has changed once in five years: Pen Hung Tung, then Alibaba's chief marketing officer, joined in January 2022 [62] and was succeeded in the Alibaba seat by Bo Liu in August 2023 [63]. One of the seven directors is female [64].
The operators
Every named executive officer came from SINA, and the CEO has run Weibo since before the IPO.
Source: FY2025 Form 20-F, Item 6.A biographies of Charles Chao and Gaofei Wang [65] and of Fei Cao, Wei Wang and Zenghui Cao [66]; years in role derived from the stated start dates to the April 2026 filing date.
Source: derived from the start dates in Item 6.A of the FY2025 Form 20-F — biographies of Charles Chao and Gaofei Wang [67] and of Fei Cao, Wei Wang and Zenghui Cao [68].
Gaofei Wang has been CEO for twelve years, Fei Cao CFO for five, and the CFO seat has turned over once since 2014 — Bonnie Yi Zhang held it from March 2014 until Cao's appointment [69]. There is no disclosed succession plan and no officer identified as a successor: Item 6.A names four executive officers, three of them below the CEO [70].
Both the CEO and CFO carry outside board seats. Gaofei Wang has been a director of DiDi Global since June 2021 and became an independent non-executive director of Distinct Healthcare Holdings in February 2026 [71]. Fei Cao is a director of Tian Ge Interactive Holdings and of INMYSHOW Digital Technology, a Shanghai-listed social and new-media marketing company [72].
One departure is visible only by comparison. Jingdong Ge, Senior Vice President, Advertising Business since April 2021, appears in the officer table of the FY2021 through FY2024 filings [73] and is absent from the FY2025 table [74]. No date, reason or successor is disclosed. As a foreign private issuer Weibo files no Form 8-K, so an officer change surfaces once a year in the 20-F roster or not at all [75]. The head of the advertising business is the officer closest to the revenue line — see Business for what that line consists of.
Employment terms are uniform and disclosed only in outline: termination for cause without remuneration for criminal conduct or wilful misconduct, perpetual confidentiality, company ownership of intellectual property developed in role, and non-competition and non-solicitation covenants running through employment [76]. No severance formula, change-of-control payment or notice period is quantified.
What the pay actually pays for
The disclosure regime sets the ceiling on what can be known. Weibo files a Form 20-F, not a proxy statement, and is exempt from the proxy rules [77]. Item 6.B reports one line: for the year ended December 31, 2025 the company paid approximately $5.5 million in cash and benefits to its executive officers as a group and $0.4 million in cash to eligible non-executive directors, with nothing set aside for pension or retirement benefits [78]. There is no individual salary, bonus, metric, weighting, threshold, target, cap, holding requirement or clawback trigger disclosed anywhere in the filing. Item 6.F, the recovery of erroneously awarded compensation, is marked "Not applicable" [79].
Sources: Item 6.B of the FY2021 [80], FY2022 [81], FY2023 [82], FY2024 [83] and FY2025 [84] Forms 20-F.
Executive cash more than doubled over five years, from $2.6 million in FY2021 to $5.5 million in FY2025 [85] [86], while revenue fell from $2.26 billion to $1.76 billion and the officer roster lost one name. Non-executive directors were paid no cash at all until FY2024 [87] [88]. Because the aggregate is a single figure, no part of it can be attributed to any individual, and none of it can be traced to an operating metric.
The equity that is disclosed
The one per-name table in Item 6.B lists award holdings, not compensation: options and restricted share units outstanding as of March 31, 2026, with strike, grant date and expiry, but no grant-date fair value and no vesting schedule.
Source: FY2025 Form 20-F, Item 6.B share incentive plans, outstanding awards as of March 31, 2026 [89].
The company reports its own Nasdaq closing prices inside the same filing: $9.55 on December 31, 2024 and $10.22 on December 31, 2025 [90]; market data puts the shares at $7.94 on August 7, 2026. Against those marks the two named tranches point in opposite directions. The March 2022 grants at $21.15 are far underwater and expire in March 2029. The March 2025 grants at $2.69 and the October 2025 grant at $2.93 were struck well below the market price prevailing through 2025, and the outstanding-option table's lowest band runs from $0.01 to $3.87, so options at nominal strikes exist in the plan [91]. These are discounted options rather than at-the-money options, which changes what they reward: the 2025 tranches carry intrinsic value even if the shares go nowhere.
Source: FY2025 Form 20-F, Note 7 Stock-Based Compensation, option activity table [92]. Weighted-average strikes were $3.87 (2023), $2.38 (2024) and $2.80 (2025).
The whole option book tells the same story from the other side. At December 31, 2025, 6,967,000 options were outstanding at a weighted-average strike of $10.68, of which 3,132,000 were exercisable at a weighted-average strike of $18.20 — the vested portion is underwater against a $10.22 close, while the unvested portion is not [93]. Aggregate intrinsic value moved from nil at the end of 2022 to $29.7 million at the end of 2025 [94], and the source of it is new low-strike grants rather than a higher share price: options in the $0.01 to $3.87 band grew from 2,069,000 to 4,247,000 during 2025, while the $21.15 and $32.68 bands only shrank [95].
The performance condition that never paid
Weibo granted performance-based restricted share units with a market condition twice — 1,640,000 units in 2022 at a grant-date fair value of $8.43, and 1,640,000 in 2023 at $9.66. Not one unit vested. The 2022 tranche was cancelled in 2024 and the 2023 tranche in 2025, leaving a nil balance and nil unrecognized cost [96].
Source: FY2025 Form 20-F, Note 7 Stock-Based Compensation, performance-based restricted share units with market condition [97].
Two facts follow from that table. The only performance-conditioned equity Weibo has granted was tied to a market condition, so it tested the share price rather than an operating metric; and having failed twice, it has not been replaced. No performance-conditioned award was granted in 2024 or 2025 [98]. What remains is time-vested: stock-based compensation amortizes over roughly four years on a straight-line basis [99], and the plan administrator sets each vesting schedule privately in the award agreement [100].
The cost, and the plan capacity
Source: FY2025 Form 20-F, Item 3.D risk factors [101] and Note 7 Stock-Based Compensation [102].
Stock-based compensation fell 58% in two years, from $101.1 million in FY2023 to $42.1 million in FY2025 [103]. The decline is mechanical: the large 2021 restricted-share-unit grants (5,737,000 units at a $47.95 average grant-date fair value) [104] have now largely vested, and the replacement grants are far smaller — 144,000 units in 2023, 69,000 in 2024, 150,000 in 2025, leaving only 310,000 service-based units outstanding at the end of 2025 [105]. A separate $5.0 million of FY2025 stock compensation went to SINA employees and was charged through the amount due from SINA [106].
Plan capacity is large relative to current usage. The 2023 Plan, adopted in March 2023, can issue up to 11,622,313 shares; 6,881,721 options and 209,304 restricted share units were outstanding as of March 31, 2026 [107], and 10,925,000 shares remained available for issuance at December 31, 2025 [108] — about 4.4% of shares outstanding, issuable without a shareholder vote, since the Nasdaq equity-plan approval rule is one of the requirements Weibo waives [109].
Against that, the counterweight is cash returns. Applied to SINA's 87,822,024 shares, the four dividend declarations since May 2023 route roughly $272 million to the controlling shareholder — the same shareholder that owes Weibo $401.9 million. The capital-allocation record behind those numbers belongs to History.
Insider activity, and what the record cannot show
There is no Form 4 record for Weibo. As a foreign private issuer, the company and its insiders are exempt from the Exchange Act provisions requiring insiders to file public reports of stock ownership and trading and from short-swing profit liability [110]. Dated insider activity is therefore observable only once a year, by differencing successive beneficial-ownership tables, and only for the group and for Chao.
Sources: Item 6.E beneficial ownership tables as of March 31, 2024 [111], March 31, 2025 [112] and March 31, 2026 [113], in the FY2023, FY2024 and FY2025 Forms 20-F. The March 2024 figure for Chao is as reported in the FY2023 table.
The movements are award-driven, not purchases. Chao's directly held position has been 545,510 Class A shares in ADS form in each of the last three tables [114] [115]; his total beneficial figure rose by 337,500 between March 2025 and March 2026, matching the increase in options exercisable within 60 days from 37,500 [116] to 375,000 [117]. Company-wide option exercises were nil in 2023, 122,000 shares at $3.87 in 2024 and 213,000 at $3.84 in 2025, producing $0.4 million and $0.8 million of cash to the company and $0.6 million and $1.6 million of intrinsic value to the holders [118]. No open-market purchase by any director or officer appears anywhere in the record.
The only encumbrance disclosed is SINA's pledge of half its Class B block [119]. The board adopted an amended insider trading policy on November 8, 2023, filed as an exhibit [120].
Related parties
Related-party dealing is not incidental here — it is the plumbing between Weibo, its parent and its second-largest shareholder.
Source: FY2025 Form 20-F, Note 10 Related Party Transactions [121] [122].
Two lines move against each other. Revenue through and to SINA has nearly halved in two years, from $66.8 million to $36.1 million, while the costs SINA charges Weibo have barely moved, at $31.7 million allocated plus $25.5 million billed in FY2025 [123]. Alibaba went the other way: advertising and marketing revenue from Alibaba rose 49% in FY2025 to $173.8 million [124], about 10% of group revenue — spent by a shareholder whose nominee sits on the board and who runs Tmall and Alimama [125].
The lending relationship
Source: FY2025 Form 20-F, Note 10 Related Party Transactions [126]; Item 7.B transactions with SINA [127]; FY2023 year-end balance per the FY2024 Form 20-F, Note 10 [128].
Weibo lends money to its controlling shareholder under a rolling series of one-year agreements so that SINA can fund its own operations and short-term capital needs. SINA drew $753.0 million and repaid $773.5 million in 2025 alone, leaving $401.9 million of loans and interest receivable at December 31, 2025 at annual rates of 1% to 4% [129] [130]. The balance has been of similar size for three consecutive years — $445.2 million [131], $417.7 million, $401.9 million — so the "one-year" framing describes the paperwork, not the exposure. Total amounts due from SINA were $441.1 million at the end of 2025 [132].
Beyond SINA, Weibo carries $544.1 million of loans and interest receivable from other related parties, up from $447.0 million a year earlier. The two named exposures are Company A, an investee providing online brokerage services, at $88.5 million, and Company B, an investee in the real estate business, at $408.3 million — the latter having grown by $49.8 million during 2025. Contractual terms run up to five years subject to extension, at rates of 1.0% to 6.0%, and no credit loss was recognised on these balances in 2025 [133].
The agreements underneath
The commercial relationship with SINA is governed by three surviving contracts, all dating from the 2014 carve-out. The master transaction agreement allocates historical liabilities, obliges Weibo to use the same auditor and fiscal year as SINA until a "control ending date," and requires the parties to share user information and activity data without charge [134]. The non-competition agreement bars Weibo from any business SINA conducts other than microblogging and social networking, and runs until the later of fifteen years from the 2014 IPO or five years after SINA drops below 20% of the votes [135]. The sales and marketing services agreement makes SINA Weibo's sales agent, reimbursed at allocated direct and indirect cost [136].
The filing's own assessment of these terms is unusually direct: the agreements "may be less favorable to us than would be the case if they were negotiated with unaffiliated third parties," the non-compete "significantly affect[s] our ability to diversify our revenue sources," and "so long as SINA continues to control us, we may not be able to bring a legal claim against SINA in the event of contractual breach" [137]. The company separately notes that SINA may make decisions in its own shareholders' interest that do not coincide with those of Weibo's other shareholders [138].
Officer and director docket
Sources: FY2025 Form 20-F, Item 7.B related party transactions and special committee [139]; share pledge risk factor [140]; Item 8.A legal proceedings [141]; Item 6.F [142]; Item 16F and the auditor's report [143] [144].
No investigation, sanction, disqualification or settlement touching a current officer or director appears in any of the five annual reports read for this tab. The one live matter reaches Weibo indirectly: an appraisal claim against SINA arising from SINA's 2021 privatization, which Weibo's independent directors are monitoring precisely because an adverse outcome could affect the shareholding and the transactions between the two companies [145]. The allegation-versus-outcome distinction matters here: SINA has lost at first instance and has an appeal pending with enforcement stayed, so the judgment exists but is not final.
Audit oversight is conventional in form. PricewaterhouseCoopers Zhong Tian has served since 2013 [146], audit fees were $1.43 million in each of 2024 and 2025 against tax fees of $0.55 million in 2025, and the audit committee pre-approves all audit and non-audit services [147]. A code of business conduct and ethics applies to directors, officers and employees and is posted on the investor relations site [148].
What the record leaves open
Four things a reader should know are missing or unreconciled rather than adverse. Individual executive compensation is not disclosed at all — no salary, bonus, metric or target for any named officer, in any year. Vesting schedules for the named option and restricted-share-unit holdings are set in private award agreements and are not published. The departure of the Senior Vice President, Advertising Business between the FY2024 and FY2025 filings carries no date, no explanation and no named successor.
And one number does not reconcile. The Black-Scholes assumption table gives a "fair value of ordinary shares" of $4.85 to $5.67 for the 2025 option grants [149], against a $10.22 close on December 31, 2025 [150] and a $11.21 weighted-average grant-date fair value on the restricted share units awarded in the same year [151]. Either the row is the underlying share price, in which case it conflicts with the two other figures, or it is the fair value of the options themselves under a label that says otherwise. The distinction changes the measured size of the discount on the 2025 grants, and the filing does not settle it. The other three gaps are disclosure choices permitted by the foreign-private-issuer regime rather than inferences about conduct.
What this business is
Weibo rents the attention of 567 million monthly users to advertisers. In FY2025 that produced $1,757.2 million of revenue, $464.8 million of operating profit and $477.1 million of free cash flow. Three things about the shape of it matter more than the headline: revenue is no higher than it was in 2019, the underlying operating margin is falling while the reported one holds up, and roughly four-fifths of the balance sheet is financial assets rather than operating ones.
Weibo describes itself as a leading social media platform in China, and reported 567 million monthly active users and 252 million average daily active users in December 2025 [1]. Of FY2025 revenue, $1,501.6 million — 85% — was advertising and marketing, and $255.6 million was value-added services, mainly membership subscriptions and game-related items [2].
FY2025 Revenue ($M)
Operating Margin
Free Cash Flow ($M)
Trailing FCF Yield
Sources: FY2025 Form 20-F, Results of Operations [3]; free cash flow and yield derived from reported operating cash flow of $519.5 million less capital expenditure of $42.4 million against the market capitalisation of $2.13 billion at 7 August 2026 [4] [5].
The user base is the raw material, not the product. Across FY2025 the platform generated $3.10 of revenue per monthly active user and $5.96 of advertising revenue per daily active user, against $0.74 per monthly user of direct platform cost. Those are small numbers by the standards of Western social platforms: revenue per monthly user is a little over four times the direct platform cost per monthly user.
Who actually pays
The accounting distinction Weibo draws is worth holding onto, because it determines who Weibo can raise prices on. The company calls the ultimate beneficiary of an advertisement the "advertiser," and the counterparty that signs the contract the "customer." When an advertising agency signs, the agency is the customer and may represent many advertisers [6]. Pricing depends on format, display location and duration; social display advertisements and promoted marketing are sold mainly on a cost-per-thousand-impressions basis, and Weibo grants sales rebates to agencies that are accounted for as variable consideration against revenue [7] [8]. Those rebates are not trivial: accrued sales rebates stood at $222.2 million at 31 December 2025, equal to 15% of the year's advertising revenue [9].
The mix between those two routes to market has been moving steadily; Industry charts the direct-versus-agency split over a longer window. Directly contracted advertising rose 28% over two years, from $437.3 million to $559.3 million, while agency-contracted advertising fell 14%, from $1,096.7 million to $942.3 million [10]. Concentration eased alongside it: the top ten agencies contributed 37%, 35% and 32% of group revenue in 2023, 2024 and 2025, and no single customer or agency reached 10% [11].
Underneath the mix shift, the buyer base is thinning. The total number of advertisers fell to 0.4 million in 2025 from 0.6 million in 2024, while average spending per advertiser excluding Alibaba rose 39%, from $2,438 to $3,385 — both, the company says, because advertisers with relatively lower budgets churned [12]. Revenue from advertising customers other than Alibaba fell 4%, from $1,381.9 million to $1,327.8 million, which Weibo attributes to fierce market competition; revenue from Alibaba rose 49%, from $116.8 million to $173.8 million, on deeper collaboration during key e-commerce marketing windows [13]. Flat advertising revenue in FY2025 is therefore the sum of a $57.0 million increase from one shareholder and a $54.1 million decline everywhere else — and Weibo states plainly that Alibaba's spending tracks Alibaba's own marketing strategy and fluctuates from time to time [14].
Related parties in aggregate — Alibaba, SINA and others — supplied $212.4 million, or 14.1%, of FY2025 advertising revenue [15]. SINA, the controlling shareholder, is also one of Weibo's sales agents under a standing services agreement [16].
The revenue itself is seasonal in a specific way: advertising spending is lowest in the first calendar quarter because of the Lunar New Year holidays, and is lifted in years with the World Cup or the Olympics [17].
The revenue plateau
Sources: FY2021 Form 20-F, Results of Operations, for 2019–2021 [18]; FY2024 Form 20-F for 2022 [19]; FY2025 Form 20-F for 2023–2025 [20].
FY2021 was the peak, at $2,257.1 million. Revenue then fell 18.6% in FY2022 and has since changed by less than one percent in either direction for three consecutive years — down 4.2%, down 0.3%, up 0.1%. FY2025 revenue of $1,757.2 million is $9.7 million below the FY2019 figure of $1,766.9 million [21] [22]. Six years, no revenue growth.
Recent reported growth also carries a currency wedge. First-quarter 2026 revenue rose 6% year over year as reported but 1% on a constant-currency basis, and advertising revenue rose 9% reported against 3% constant currency [23]. Value-added services fell 11% in the same quarter on weaker game-related revenue [24].
Where the margin went
Weibo's cost of revenues covers bandwidth and infrastructure, revenue-sharing paid to creators and partners, advertisement production, platform labour and the turnover taxes levied on revenue — including a cultural business construction fee charged on advertising revenue at 1.5% through to the end of 2027 [25] [26]. Because Weibo is the principal in campaigns involving key opinion leaders, the share of revenue paid out to those creators runs through cost of revenues on a gross basis [27].
Sources: derived from reported cost lines and revenue, FY2021 Form 20-F [28], FY2024 Form 20-F [29] and FY2025 Form 20-F [30].
Revenue in FY2025 was within half a percent of FY2019, but operating income was $464.8 million against $597.6 million — $132.8 million lower on the same revenue, a margin of 26.5% against 33.8% [31] [32]. The chart locates almost all of that. Cost of revenues went from 18.6% of revenue to 24.0%, sales and marketing from 26.3% to 27.9%, and product development from 16.1% to 18.5%; only general and administrative fell, from 5.1% to 3.2%. The platform-cost line, in other words, has absorbed 5.4 points of margin over six years on an unchanged revenue base.
The reported margin against the underlying one
That fall in general and administrative expense repays a closer look, because it is what holds FY2025's reported operating margin where it is while the other cost lines rise. General and administrative expense fell from $117.6 million in 2023 to $55.9 million in 2025 [33]. Two items account for essentially the whole $61.7 million decline. Stock-based compensation charged to the line fell $12.1 million, from $24.2 million to $12.1 million [34]. The rest is the allowance for credit losses, which sits in general and administrative expense by the company's own definition [35]: 2023 carried a $19.1 million provision, and 2025 carried a $32.1 million reversal [36]. That is a $51.2 million swing in credit-loss accounting across two years, on the receivables of an advertising business.
Excluding the FY2025 reversal, operating income was about $432.7 million, a 24.6% margin, against about $492.0 million and 28.0% for FY2023 on the same basis. Weibo's own non-GAAP measure, which adds back stock-based compensation and acquisition intangible amortisation but leaves the credit-loss line inside, tells the same story: non-GAAP operating income of $592.1 million in 2023, $584.1 million in 2024 and $523.6 million in 2025, with the non-GAAP margin falling from 34% to 30% [37] [38].
The counter-fact worth stating in the same breath: the reversal was not a pure accounting stroke. The receivables note shows $27.0 million of the movement came from collecting amounts previously written off — real cash, arriving late [39]. What it is not is repeatable.
The recent quarters
Sources: quarterly results announcements, Q2 2023 through Q1 2026; fourth quarter 2025 [40] and first quarter 2026 [41].
The fourth quarter of 2025 is the outlier: revenue rose 4% year over year to $473.3 million while operating income fell from $117.9 million to $91.6 million, taking the margin from 26% to 19% [42]. Cost of revenues in that single quarter rose 23%, from $100.5 million to $123.4 million, and product development rose 21% [43]. In the first quarter of 2026 the pattern repeated in milder form: total costs and expenses rose 8% on higher advertisement production and marketing cost, partly offset by lower general and administrative expense, and the non-GAAP margin fell from 33% to 28% [44].
Management frames this as deliberate. On the first-quarter 2026 call the CFO described major investments in advertising product capabilities, the content marketing ecosystem and client service offerings, to be managed "with ROI discipline and within a controllable budget framework" [45]. On the same call the CEO described the state of the customer base: automotive key accounts seeing double-digit sales declines, handset makers absorbing higher memory costs, and e-commerce clients under profitability pressure [46]. Spending more to sell to buyers who are themselves under pressure is a coherent strategy; it is also the mechanism by which a 34% margin became a 30% one.
What sits below the operating line
Reported net income tells a materially different story from operating income, and the difference is not the advertising business.
Source: FY2025 Form 20-F, consolidated statements of comprehensive income [47].
Non-operating items added $140.8 million to FY2025 pre-tax income, against a $73.7 million subtraction in FY2024 — a $214.5 million swing that is the whole reason net income rose 49% on flat revenue and lower operating profit [48]. Two components dominate: a $76.7 million equity-method gain, against a $12.2 million loss the year before, and net interest income of $34.4 million on a large cash and investment book [49]. Neither is advertising. Both reversed in the first quarter of 2026, when equity pick-up losses of $22.1 million and a $35.0 million fair-value loss turned a $22.1 million non-operating gain into a $59.9 million non-operating loss, and net income attributable to shareholders fell from $107.0 million to $34.7 million on a quarter of higher operating profit [50].
Tax is a structural cost, not a residual. Weibo's China operations earned $606.7 million pre-tax in FY2025 at a 16.6% effective rate, helped by High and New Technology Enterprise status worth $30.9 million and research super-deductions worth $18.2 million; the group rate was 23.9%, and the gap is largely withholding tax on moving money out of China — $41.9 million accrued in FY2025 alone [51] [52].
Cash conversion
Operating cash flow was $519.5 million in FY2025 against capital expenditure of $42.4 million, so free cash flow was $477.1 million — 103% of operating income and 27.2% of revenue [53] [54]. This is a genuinely capital-light operation: capital expenditure has run between 2% and 4% of revenue.
Operating cash flow has nonetheless fallen for two straight years, from $672.8 million in 2023 to $639.9 million in 2024 and $519.5 million in 2025, while operating income barely moved [55]. Most of that is mechanical rather than a deterioration in collection: the stock-based compensation add-back shrank from $101.1 million to $42.1 million over the same two years [56]. Lower non-cash pay is an economic improvement that reduces reported operating cash flow; the $59.0 million decline in that add-back accounts for 38% of the $153.3 million fall in operating cash flow. Working capital moved the other way in FY2025, with accounts payable up $69.9 million [57].
What the balance sheet actually holds
Total assets were $7,091.2 million at 31 December 2025 against shareholders' equity of $3,974.7 million [58]. Very little of it is the advertising business.
Source: derived from the FY2025 Form 20-F consolidated balance sheet [59] and Note 8, Other Balance Sheets Components [60].
Operating assets — receivables, property and equipment, lease assets, goodwill and acquisition intangibles — total roughly $1,102 million, 16% of the balance sheet. Financial assets of roughly $5,808 million make up 82%: $2,405.1 million of cash and short-term investments, $1,663.3 million of long-term investments in listed and private companies and funds, $620.5 million of long-term wealth management products, $544.2 million of loans to related parties and $441.1 million due from SINA [61] [62]. The SINA balance is a series of rolling one-year loans; SINA drew $753.0 million and repaid $773.5 million during 2025, leaving $401.9 million of loans and interest receivable outstanding [63].
Against those assets sit $1,863.6 million of long-term debt: $745.6 million of unsecured senior notes, $794.0 million of long-term loans and $323.9 million of convertible notes, with the group holding $2,405.1 million of cash and short-term investments [64] [65]. Purchase commitments, mainly minimum commitments for marketing activity and internet connection, were $612.1 million [66].
The long-term investment book has a history of its own, which The Investing Record reads across seven years of deployment and marks.
Where the money is, and where the claims on it are
Of the $2,405.1 million of cash and short-term investments at 31 December 2025, $2,028.5 million sat with entities in mainland China — including $836.9 million inside the variable interest entities — and $376.5 million was held outside mainland China [67]. All $1,863.6 million of the debt sits at Weibo Corporation, the Cayman Islands holding company, which itself held $286.4 million of cash and $16.5 million of short-term investments [68]. Moving money from the first place to the second is taxed and regulated, with a 5% withholding tax on distributions from the wholly foreign-owned enterprises to Weibo Hong Kong and $728.3 million of net assets restricted from distribution at year end [69]; 86% of FY2025 revenue is earned by entities Weibo does not own and controls only by contract [70]; Claims on the Cash sets out the four-step route from a yuan of advertising revenue to an ADS holder, and The Ownership Chain the contracts themselves.
Cash has been leaving that chain. Dividends of $195.6 million were paid in 2025 and the board declared $0.61 per share for FY2025, about $150 million, payable in May 2026 — down from $0.82 in each of the two prior years [71].
Headcount and the shape of the operation
Employee numbers fell from 5,268 at the end of 2023 to 4,982 at the end of 2024, then rose to 5,651 at the end of 2025 [72]. Revenue per employee was $311,000 in FY2025 and operating income per employee $82,000. The 13% headcount increase in a flat-revenue year is consistent with the cost lines: this was a year of adding people and spending on product, not of harvesting.
What the report tests
Weibo converts an unchanging revenue base into roughly a quarter of it as operating profit and about $477 million a year of free cash flow, and the market capitalises the whole company at $2.13 billion — about 4.5 times that free cash flow, against $2,405 million of cash and short-term investments and $1,864 million of debt. The report tests two things: whether that cash flow is durable at anything close to its current level, and whether an outside shareholder can actually reach it through a contractual VIE, a taxed remittance chain, a Cayman holding company carrying all the debt, and a controlling parent that is also a customer, a sales agent and a borrower.
The evidence in this chapter cuts both ways on the first of those. Against durability: revenue has not grown in six years, the advertiser count has fallen by a third in one year, the underlying operating margin has lost about four points in two years, and FY2025's flat advertising line was carried entirely by one shareholder's spending. For it: the business still converts 27% of revenue to free cash flow on 2–4% capital intensity, concentration among agencies is falling rather than rising, and management's added cost is going into monetisation capability rather than into user acquisition. The read that fits the evidence best is that the cash flow is real but that the current margin is not the run-rate — the FY2025 figure is flattered by a $32.1 million credit-loss reversal that will not repeat, and the two most recent quarters show margin at 19% and 26%. What would change that read is two or three quarters in which advertising revenue excluding Alibaba grows on a constant-currency basis while the cost lines hold — which is precisely what management said it is spending to achieve.
Advertising Base
Weibo's advertising line has been flat for three years at about $1.50 billion, but the flatness is assembled from parts moving in opposite directions. Arm's-length third-party revenue has fallen every year of the record; related-party advertising has more than halved; Alibaba's spend rose 49% in 2025 and covered the gap. Underneath, revenue per daily user has almost stopped falling, and the audience has started to.
What the flat line is made of
Weibo reports advertising revenue split four ways — third parties, Alibaba, SINA, and other related parties. The split is where the flat headline comes apart. Between 2021 and 2025 the third-party book fell from $1,633.2 million to $1,289.3 million, and it fell in every single year [1] [2].
Sources: FY2025 Annual Report (Form 20-F), Results of Operations [3]; FY2023 Annual Report (Form 20-F), Results of Operations [4]. The 2021 Alibaba figure of $181.2 million includes $41.7 million earned through an Alibaba advertising-agency subsidiary that stopped acting as agent after 2022.
The FY2025 movement decomposes the same way. Weibo tells shareholders that advertising revenue excluding Alibaba fell 4%, to $1,327.8 million, "mainly attributable to fierce market competition" [5]. That $54.1 million decline is not one book shrinking. Slightly more than half of it is related-party advertising running off: SINA's own spend fell $10.7 million and other related parties fell $17.6 million, together $28.3 million. The arm's-length third-party book fell $25.8 million — a decline of 2.0%, the slowest of the five-year record.
Source: FY2025 Annual Report (Form 20-F), Results of Operations table [6]; percentage changes derived.
Two readings follow, and they point in different directions. The encouraging one is that the third-party book — the part an outside buyer is actually underwriting — has decelerated its decline in each of the last four years: down 14.7% in 2022, then 3.5%, 2.2% and 2.0%. The unwelcome one is that the two cushions used to hold the headline flat are close to exhausted. Related-party advertising has fallen from $166.3 million in 2021 to $38.5 million, or from 8.4% of the advertising line to 2.6%. And Alibaba, at $173.8 million, is now 11.6% of advertising revenue and supplied more than the whole of FY2025's growth — a line Weibo itself describes as tracking Alibaba's own marketing strategy, "which fluctuates from time to time" [7].
One defence used in earlier years no longer applies. In 2023 and 2024 Weibo attributed the ex-Alibaba decline partly to renminbi depreciation against the dollar [8] [9]. For FY2025 the company reports advertising revenue as flat both in dollars and on a constant-currency basis [10]. Currency was neutral in 2025; the 3.9% fall in the ex-Alibaba book was real.
The buyer base behind that book thinned faster than the revenue: 0.4 million advertisers in 2025 against 0.6 million in 2024 and 0.7 million in 2023, with average spend per advertiser excluding Alibaba up 39%, from $2,438 to $3,385, both of which Weibo attributes to churn among advertisers with relatively lower budgets [11]. The same filing supplies a mechanical alternative: revenue from advertisers contracting with Weibo directly rose 15% in 2025, to $559.3 million, while revenue billed through advertising agencies fell 7%, to $942.3 million [12]. The definitions printed beside that table rule it out; Weibo counts an advertiser as the ultimate beneficiary of the advertisement and a customer as whoever signs the contract, and a single agency may represent and serve multiple advertisers, so moving a beneficiary from an agency contract to a direct one leaves the advertiser count untouched [13]. The accounts are leaving rather than being reclassified, and the revenue that left went from the agency-billed side. What the record cannot settle is what those accounts were worth: no filing publishes a revenue distribution by advertiser size or an advertiser count split by billing channel, so the 39% rise in average spend is consistent both with small accounts churning out and with budgets concentrating among the large ones.
Users and revenue per user
The ex-Alibaba book can be split again, into how many people use Weibo daily and how much advertising revenue each of them carries. Weibo publishes December daily active users each year, so the ratio is computable across the record — with the caveat that a December headcount is being divided into a full year of revenue, which makes the level approximate and the year-on-year direction reliable.
Source: derived from December DAU figures in the FY2023, FY2024 and FY2025 Annual Reports [14] [15] [16] and the company's disclosed advertising revenue excluding Alibaba [17] [18].
The character of the decline changed in 2025. Through 2022, 2023 and 2024 the audience grew slightly every year while revenue per daily user fell — by 20.1%, then 6.4%, then 4.0%. That is a monetisation problem. In 2025 the pattern inverted: revenue per daily user was down only 0.9%, from $5.32 to $5.27, while daily users fell 3.1%, from 260 million in December 2024 to 252 million in December 2025 [19]. Practically the whole of last year's ex-Alibaba decline was a smaller audience rather than a cheaper one.
That matters for how the next few years are underwritten. Price stabilising is the harder of the two things to achieve and it appears to have happened; the ex-Alibaba line is now most sensitive to daily users, which fell 3.1% in 2025 against a 0.9% fall in revenue per daily user. Weibo's monthly user base and the feed rebuild behind its recent fall are recorded in the industry backdrop and the company record, and are not re-argued here. What the record does not contain is any disclosure of impression volume, ad load, or price: "impressions" appears in the FY2025 filing only inside the revenue-recognition policy for cost-per-thousand-impression contracts. Inside revenue per user, price and volume cannot be separated from the primary record.
Flat against a growing market
Flat revenue and stable share are not the same thing. Third-party trackers put China's internet advertising market at roughly 6% growth in 2024 and 5% to 6% through the first three quarters of 2025 (QuestMobile data, reported in the trade press; no market-size or share figure appears anywhere in Weibo's own filings, and none of this can be cited to the corpus). Against that, Weibo's arm's-length book fell about 2% and its ex-Alibaba book fell 3.9%, both on a currency-neutral basis.
The nearest listed comparator in the corpus tells the same story from the other side: Bilibili's advertising revenue rose 22.8% in 2025, to RMB10.1 billion, which it attributes to improved ad products and advertising efficiency [20]. The full named-rival record sits in the competitive map; the point here is narrower. Measured in constant currency, so that both sides are effectively renminbi, the gap between Weibo's advertising growth and the market's has run at roughly seven to ten percentage points in each of the last two years. Flat revenue in a market compounding at 5% to 6% is a shrinking position, not a stable one.
Quarter by quarter
The quarterly series shows why "flat" feels unstable when read close up. Stripping Alibaba out, non-Alibaba advertising revenue has swung between minus 12.5% and plus 10.1% year on year over the last nine quarters, on a base that barely moves.
Source: quarterly disaggregation tables in the Q4 2025 [21], Q3 2025 [22], Q1 2025 [23], Q4 2024 [24] and Q1 2026 [25] results announcements, with the 2022 and 2023 quarters and the two second quarters taken from the Q3 2023 [26], Q4 2023 [27], Q1 2024 [28] and Q2 2025 [29] announcements.
Every one of those swings is explained by an event, not by a change in underlying demand. The company's own attributions read like a marketing calendar.
Sources: Q4 2024 [30], Q1 2025 [31], Q2 2025 [32], Q3 2025 [33], Q4 2025 [34] and Q1 2026 [35] results announcements, with the 3Q25 sector detail from the Q3 2025 earnings call [36] [37]; year-on-year percentages derived from the disaggregation tables.
Management states the mechanism plainly. Asked in May 2026 why revenue was growing while its customers were struggling, the CEO answered that Weibo's "ad revenue and ad budgets was primarily related to the frequency of the new product launches of the different verticals as well as the sales, but not necessarily related to the operational result of the customers in different verticals" [38]. The company has been building toward that position deliberately: in the fourth quarter of 2024 it described revenue from new product launch marketing growing by double digits while total advertising fell [39].
That is a coherent franchise, and it is also what makes the base hard to call: revenue built on launch moments gets a Paris Olympics and then laps one, gets a wave of blockbuster game releases and then laps that too.
The first quarter of 2026 is the most recent evidence, and it reads both ways. Reported advertising revenue rose 9%, but 3% in constant currency, with the company naming currency first among the causes [40] [41]. Applying the same currency effect to the non-Alibaba line takes its reported 10.1% to roughly 4% in constant currency, its strongest quarter on that basis since at least the start of 2024. The composition is what qualifies it. The three named contributors were internet services, driven by large-language-model developers ramping marketing around Chinese New Year; local services, "supported by ongoing competition in the food delivery" business; and automobiles, on new vehicle launches [42] [43]. All three are budget waves rather than run-rates, and management said as much on the same call: the food-delivery promotional budget was "not as intense as before" going into the second quarter, and e-commerce faced "a very high base number in entering into Q2" [44].
The customers behind those budgets are under visible strain. On the same call the CEO described automotive key accounts seeing double-digit sales declines, handset makers cutting prices as memory costs rise, and e-commerce clients in a "stressful profitability situation" [45].
What would make it a floor
Two supports in the record argue for stabilisation, and both are specific to what Weibo sells rather than to the cycle.
The first is a change in how Chinese advertisers are taxed and priced. On the third-quarter 2025 call management reported that after years of budget migration into performance advertising, bidding for commercial traffic had become intense enough to push client costs up, and that the government had issued a tax policy limiting the deductibility of feed advertising spend. Together these were driving clients to reassess allocation and place "renewed emphasis on the value of the brand advertising", with celebrity endorsement named as the favoured route [46]. Brand and celebrity marketing is the part of the market Weibo is structurally best placed in.
The second is that the tooling is improving on measurable terms. By the end of October 2025 AI-generated creative accounted for nearly 30% of ad creative consumption on the platform [47]. That is a cost and throughput gain for advertisers rather than a new revenue line, but it is the kind of change that shows up first in retention of existing budgets.
Against those, three facts cut the other way. The customer mix has not refreshed: Weibo's three largest verticals were fast-moving consumer goods, 3C products and e-commerce in the third quarter of 2021, the same three across full-year 2024, and the same three again in the third quarter of 2025 and the first quarter of 2026 [48] [49] [50] [51]. Two of those three are the ones management repeatedly names as the drag. Second, the other 15% of revenue has turned down: value-added services fell 11% in the first quarter of 2026, and 15% in constant currency, on lower game-related revenue [52] [53]. Third, related-party advertising is down to 2.6% of the line, so the part of any future decline that can be attributed to related parties running off, rather than to lost arm's-length demand, is now close to nil.
Consensus sits close to the flat case: $1,802.7 million of revenue for FY2026 and $1,841.4 million for FY2027, about 2.6% and 2.1% growth [54].
On the balance of that evidence, the arm's-length advertising book is decelerating toward a floor rather than sitting on one, and the flat headline of the last three years was held up by an Alibaba line that grew 49% in a single year and by related-party revenue that has almost run out. Weibo prices launch moments well, and the shift of Chinese budgets back toward brand work suits it; what it has not yet shown is an ability to hold revenue steady in a market growing 5% to 6%.
The strongest fact against that read is the deceleration itself: a third-party book falling 14.7%, 3.5%, 2.2% and 2.0% in successive years is converging on something, and revenue per daily user was down less than one percent in 2025. What would change the read in either direction is narrow and observable. Two consecutive quarters of positive constant-currency growth in the non-Alibaba book without an event base to lean on, together with daily users holding at or above 252 million, would establish the floor; daily users were 254 million in March 2026 [55] and management described "initial signs of stabilization in core user engagement and advertising demand" [56]. A second year of Alibaba spend growing while everything else falls would establish the opposite — that the reported line is being held up by a single related party whose budget Weibo does not control.
The free cash flow examined in Business and the obligations examined in Claims on the Cash are both sized off this $1.5 billion advertising base.
Claims on the Cash
Up to $1,130 million of principal can fall due in 2027 at the Cayman parent, which held $302.9 million of the group's $2,405.1 million of liquid assets and has taken no subsidiary dividend since at least 2023, while $757.9 million of the group's $2,298.9 million of cash sat at 31 December 2025 inside contractually controlled entities that carry $84.0 million — 2.1% — of the group's $3,974.7 million of shareholders' equity and pay $706.4 million a year out to the WFOE as a service fee whose price the WFOE sets. Each of those figures is a line of the FY2025 20-F: the group liquidity total is in Item 5.B [1]; the $302.9 million at the parent and the $757.9 million in the VIE column of $2,298.9 million of group cash come from the cash and cash equivalents and short-term investments rows of the condensed consolidating balance sheet at 31 December 2025 [2]; the same schedule's total shareholders' equity row shows $84,041 thousand against $3,974,735 thousand [3]; the $706.4 million of service fees paid up to the WFOE is in Item 3 [4]; the absence of any subsidiary dividend to Weibo Corporation since 2023 is on the same page [5]; and the 2027 principal is the $800 million term-loan balance plus the $330 million convertible put in Note 15 [6].
The strongest fact against reading that as a squeeze is the parent's own record of meeting large claims. It repaid $800 million of senior notes in 2024 [7], settled in July of that year [8]; it paid $200.1 million, $194.4 million and $195.6 million of dividends to shareholders across 2023, 2024 and 2025 [9]; and it declared about $150 million more in March 2026 [10]. None of it was funded by a drawn facility: the $300 million revolving facility signed alongside the 2027 term loan was repaid to nil in the third quarter of 2025 and cancelled [11]. The money arrived from below as loan repayment rather than dividend — $903.0 million across 2024 and 2025 [12].
The claim itself is measurable. Against the $1,130 million, the parent held $302.9 million of its own cash and short-term investments at the last balance-sheet date, plus $606.8 million owed to it by subsidiaries and $354.8 million owed to it by SINA — $1,264.5 million if both receivables come back in cash [13]; strip out the SINA line and the parent is roughly $220 million short on its own resources and has to be refilled from China. Refilling it as a dividend carries the treaty toll: grossing $1,130 million up through the 5% Hong Kong rate costs about $59.5 million, or roughly $0.24 per share on the 245,549,858 shares outstanding [14]. Read against the recovery table in What the Price Implies, $59.5 million is about 1.5 points of recovery on the $3,944.2 million net financial book, and moves the residual left for the operating business by the same $59.5 million against $1,949.7 million at zero recovery. The toll is small at that scale; the open variables are whether the cash moves and when.
The 2027 window
The maturity profile is not evenly spread. The $900 million term loan signed in August 2022 with a group of 23 arrangers, of which $800 million remains after a $100 million repayment in the fourth quarter of 2023, matures on 22 August 2027 [15]. Four months later, on 6 December 2027, holders of the $330 million 2030 Convertible Notes may require the company to repurchase them for cash at 100% of principal [16].
Whether that put gets exercised is closer to arithmetic than judgment. The notes convert at 72.6929 ADSs per $1,000 of principal [17], a conversion price of about $13.76 per ADS. The shares closed at $7.94 on 7 August 2026, 42% below that level. The company's own accounting already treats 2027 as the operative date: it amortises the notes' issuance costs to the December 2027 put date rather than to the 2030 maturity [18].
The 20-F's contractual commitments table nonetheless schedules the convertible principal in the three-to-five-year bucket, at final maturity. Shifting it to the put date is the more conservative reading of the same disclosure.
Source: FY2025 20-F, Note 16 Commitments and Contingencies, other commitments table [19]. Derived: the put-exercised column moves the 2030 Convertible Notes' $330.0 million principal from the three-to-five-year bucket into the one-to-three-year bucket and drops the $9.1 million of coupon that would otherwise accrue between the put and the 2030 maturity, per the 6 December 2027 put date [20].
Those parent-level resources — $302.9 million of its own liquid assets, $606.8 million owed by subsidiaries and $354.8 million owed by SINA [21] — line up against the 2027 principal as follows.
Sources: parent-column balances from the FY2025 20-F condensed consolidating balance sheet [22]; 2027 principal is the $800 million term-loan balance plus the $330 million convertible put [23].
Nothing in the record suggests distress. Refinancing an $800 million bank facility, for a company with $2.4 billion of group cash, a 26% operating margin [24] and $477 million of annual free cash flow [25], is a routine transaction in normal markets. What is notable is that none of it is discussed in public. Across the sixteen indexed earnings-call transcripts, spanning five years, the terms "senior notes", "term loan", "convertible" and "refinancing" do not appear once, from either management or an analyst. The calls cover the returns side instead: a buyback update in the third quarter of 2022 [26], and on the March 2025 call an analyst question on the dividend, which the chief financial officer answered with capital-allocation principles and an openness to buybacks [27]. A reader relying on the calls would not know the 2027 window exists.
The parent's own balance sheet
Weibo Corporation is a Cayman Islands company that owns no operating assets. In the condensed consolidating schedule the 20-F is required to publish, the parent's line for third-party revenue is a dash — in 2025 [28] and in 2024 and 2023 [29]. What it does own is every dollar of the group's borrowings: $745.6 million of 2030 Senior Notes, $794.0 million of 2027 term loans and $323.9 million of 2030 Convertible Notes, all booked in the parent column and nowhere else [30].
The consolidated totals average that split away.
Parent cash + ST investments ($M)
Parent debt ($M)
Parent liquid / parent debt
Group cash + ST investments ($M)
Source: FY2025 20-F, condensed consolidating balance sheet at 31 December 2025, Weibo Corporation column — parent cash and cash equivalents and short-term investments [31]; group total from Item 5.B Liquidity and Capital Resources [32].
The gap between the two liquidity measures has widened every year of the record. Group cash and short-term investments have moved in a band between $2.35 billion and $3.23 billion since 2022. The parent's own liquid balance has fallen from $1,329.7 million to $302.9 million over the same four years, a decline of 77%, while parent debt fell 23%.
Sources: FY2025 20-F condensed consolidating balance sheets — parent-column cash and cash equivalents, short-term investments and borrowings — for 2025 [33], 2024 [34] and 2023 [35]; FY2023 20-F for 2022 [36]. Derived: parent debt is the sum of the parent column's unsecured senior notes, convertible senior notes and long-term loans.
The mechanism behind that decline is visible in the same schedule. The parent's own operating cash flow is negative every year — outflows of $84.9 million in 2023 [37], $82.8 million in 2024 and $55.1 million in 2025 [38], because interest and holding-company costs are its only recurring items. It funds itself by calling in money it had lent downstream: net receipts from subsidiaries of $581.0 million in 2024 and $322.0 million in 2025 [39].
That is a sensible route — repayment of an intercompany loan is not a distribution and carries no withholding — but it is a finite one. The parent's claim on its own subsidiaries has fallen from $1,438.6 million at the end of 2023 [40]; a year later it stood at $857.5 million [41]; at the end of 2025, $606.8 million [42] — 58% drawn down in two years, most of it consumed by the $800 million senior-note repayment [43], settled in July 2024 [44].
Source: FY2025 20-F, condensed consolidating balance sheet, Weibo Corporation column [45].
The route out of China
At 31 December 2025, $2,028.5 million of the $2,405.1 million total sat inside mainland China, including $836.9 million inside the VIEs themselves — cash and short-term investments on the Item 5.B basis, against the $757.9 million of cash and cash equivalents in the VIE column of the condensed consolidating balance sheet [46]; $376.5 million sat outside, of which the Cayman parent held $302.9 million [47]. The Hong Kong company that receives WFOE distributions, and the rest of the non-PRC group, held roughly $74 million between them. A year earlier the offshore pocket had been $862.3 million [48].
Cash reaches the parent in four steps, each disclosed and each with its own friction. The VIEs pay service fees to the WFOE under the exclusive technical services, sales agency and trademark licence agreements — $757.8 million, $769.0 million and $706.4 million in 2023, 2024 and 2025 [49]. The WFOE then either lends to Weibo Hong Kong or dividends to it. Both channels have thinned. WFOE loans to Weibo Hong Kong ran at $406.6 million and $447.1 million in 2023 and 2024, then $16.1 million in 2025 [50]. WFOE dividends of $406.1 million and $401.6 million were paid up in the fourth quarters of 2023 and 2024, each carrying about $20 million of withholding tax remitted directly to the PRC authorities; no equivalent 2025 distribution is disclosed [51].
Two disclosures set the boundary of what can move at all. First, $728.3 million of net assets was restricted at year-end — paid-in capital and statutory reserves that PRC law does not permit to be distributed, up from $567.2 million in 2023 [52]. Second, and much larger, the tax note reports RMB17.7 billion of undistributed PRC earnings at the end of 2025, down from RMB20.3 billion, "which are expected to be indefinitely reinvested in the Group's business for the foreseeable future" [53]. At the 20-F's own translation rate of RMB6.9931 to the dollar [54], that is about $2,531 million of accumulated earnings against which no deferred tax has been provided, because the company does not presently intend to bring them out.
The toll on what does move is modest but recurring: 5% withholding on WFOE-to-Hong Kong dividends under the mainland–Hong Kong treaty, and the group has accrued $43.7 million, $22.1 million and $41.9 million of it across 2023, 2024 and 2025 — $107.7 million in three years [55]. The 2025 accrual is the most interesting of the three, because it was not matched by a distribution. Management "revisited the reinvestment plan and expanded the distribution scope from Weibo Technology to all WFOEs under Weibo HK" and booked tax on that widened pool [56]. An accrual of $41.9 million at 5% implies roughly $838 million of retained earnings now earmarked to come out. Booking the tax before any distribution implies that the widened pool is intended to come out, which cuts against reading the thinning of the offshore pocket as structural.
The last step, Hong Kong to Cayman, is untaxed but has not been used. The filing states plainly that for each of 2023, 2024 and 2025, "no dividends or distributions were made to Weibo Corporation by our subsidiaries" [57]. Everything the parent has received in three years arrived as loan repayment.
The company publishes its own end-to-end cost. In the hypothetical table the 20-F is required to give, RMB100 of pre-tax VIE earnings reaches the parent as 67.5 after 25% enterprise income tax and 10% withholding; in the scenario where the service-fee structure is disallowed and cash has to leave the VIEs by non-deductible transfer, the figure falls to about 50.6%, a possibility management describes as remote [58].
Who owes the rest
Beyond cash, $1,700.2 million of the balance sheet is money lent out on term rather than held on deposit, and $946.0 million of that is lent to related parties.
Sources: FY2025 20-F Note 8 Other Balance Sheet Components [59], Note 10 Related Party Transactions [60] and Note 14 Fair Value Measurement [61].
Two of those rows deserve more than a line in a table.
The loan to the parent company. SINA borrowed and repaid close to a billion dollars a year through the record: drawings of $1,105.7 million, $966.6 million and $753.0 million in 2023, 2024 and 2025, against repayments of $1,071.1 million, $970.9 million and $773.5 million, leaving a balance that has never left a narrow band — $420.4 million and $445.2 million at the end of 2022 and 2023 [62], then $417.7 million and $401.9 million [63]. The stated rate is 1% to 4%, with maturity within one year [64]. Interest earned on it was $14.9 million, $13.1 million and $10.8 million, a realised yield of 3.4%, 3.0% and 2.6% on the average balance [65].
In the same year, Weibo paid $48.5 million of interest on the $800 million term loan it owes its banks, or 6.1% [66]. Applying the $401.9 million receivable against that facility rather than leaving it outstanding would be worth about 3.5 percentage points on $402 million — roughly $14.1 million a year, or 3.0% of FY2025 operating income. The counter-fact is that the whole interest-bearing book is low-yielding: group interest income of $116.8 million on roughly $4.1 billion of cash, deposits, wealth products and loans is a blended 2.9% [67], so 2.6% on one-year paper is not far off what the rest of the book earns. The narrower point stands: the same balance sheet borrows at 6.1% offshore and lends at 2.6% to its controlling shareholder, and that receivable is renewed annually rather than repaid. The control and share-pledge history behind the relationship is set out in People.
The loan to a property company. The larger and less examined line is Company B, described in four successive filings only as "an investee in real estate business". Its balance was $454.9 million at the end of 2022 and $349.7 million in 2023 [68]; $358.5 million in 2024 [69]; and $408.3 million in 2025 [70]. The FY2024 filing records that "in 2023 and 2024, several loans were extended and the Group accounted for such extension as loan modification" [71]. The disclosed rate range on the category has fallen at the bottom end over the same period: 4.0% to 6.7% in 2022 and 2023 [72], 5.0% to 6.6% in 2024 [73], 1.0% to 6.0% in 2025 [74] — though new counterparties entered the line in 2025, so the widening is not attributable to Company B alone.
No credit loss has been recognised on these loans in 2025, and $1.5 million in 2024 [75]. The wider property-linked exposure is aggregated in The Investing Record.
The equity book. The remaining $1,663.3 million of long-term investments [76] is the least liquid tier, and its seven-year deployment record and marks are read in The Investing Record.
The arithmetic that follows
At the 7 August 2026 close of $7.94, the 245,549,858 shares outstanding at the last balance-sheet date [77] carry a market value of about $1.95 billion. Group net cash of $541.5 million — cash and short-term investments of $2,405.1 million less $1,863.6 million of debt — is 28% of that. The same balance sheet read from the parent's side is $1,560.6 million of net debt.
Neither figure is right on its own. The group net-cash number treats onshore renminbi held inside contractually controlled entities as interchangeable with dollars in a Cayman account, which the tax note and the distribution record say it is not. The parent net-debt number ignores that subsidiaries do send money up, in size, when the parent needs it — $903.0 million across 2024 and 2025 alone. The honest middle is that group cash is reachable at a cost and on a delay: 5% at the Hong Kong step on anything routed as a dividend, statutory reserves of $728.3 million that cannot move at all, and a stated intention to leave RMB17.7 billion of accumulated earnings in China indefinitely.
The claims already committed against the offshore pocket are growing. The March 2026 dividend was set at $0.61 per share, about $150 million, down from $0.82 [78], and the December 2025 repurchase authorisation was set at $200 million, running to the end of 2026 [79]. Both are paid from the same pocket that has to meet 2027. On the first-quarter 2026 balance sheet, group cash and short-term investments were $2,594.2 million, debt was $1,865.5 million, and the SINA loan stood at $397.9 million — $4.0 million lower in three months [80].
The read this chapter supports is that Weibo's cash is real and is generated by the operating engine described in Business, but that the consolidated net-cash figure overstates what is available in any given year to service debt or reach shareholders — by roughly the sum of restricted reserves, the indefinite-reinvestment assertion and $946.0 million of related-party credit that rolls rather than returns. The strongest fact against that read is the $41.9 million withholding accrual on a widened distribution scope: management has already booked the tax on bringing roughly $838 million more out of China, which is what preparing for 2027 looks like. Three developments in the record would change that read: a subsidiary dividend to Weibo Corporation, which has not occurred since at least 2023; repayment rather than renewal of the SINA facility at its next annual roll; and a term refinancing of the August 2027 loan announced with time to spare.
The Ownership Chain
An ADS is a share in a Cayman company that holds no equity in the entities earning 86% of Weibo's revenue. Those entities are legally owned by four named individuals, two of them serving Weibo officers, and are held by nine sets of contracts the filing says have never been tested in court. The structure is conventional for a Chinese internet issuer. What is specific here is who holds the register, what the licence file still lacks, and how little enforcement has ever cost.
What the contracts actually hold
Weibo Corporation states the position plainly on the first page of Item 3: it "is not an operating company in China, but a Cayman Islands holding company with no equity ownership in the VIEs," and investors in its Class A shares and ADSs "are not purchasing equity interest in our operating entities in China" [1]. Revenue contributed by the two variable interest entities and their subsidiaries was 87.0%, 86.2% and 85.9% of group revenue in 2023, 2024 and 2025 [2].
The two entities are Beijing Weimeng Technology Co., Ltd. and Beijing Weimeng Chuangke Investment Management Co., Ltd. Weimeng holds the Internet Content Provision Licence, the Online Culture Operating Permit and the domain names; Weimeng Chuangke holds the investments [3]. The reason for the arrangement is a bright-line rule rather than a preference: foreign ownership of an internet content provider may not exceed 50% under PRC law, and Weibo Technology, the wholly owned PRC subsidiary, is a foreign-invested enterprise [4].
The 20-F's condensed consolidating schedule shows what that means line by line. In 2025 the VIE column carried $1,509.9 million of third-party revenue and $143.3 million of net income, against $2,211.6 million of assets and $2,094.8 million of liabilities [5] [6].
Source: derived from the FY2025 20-F condensed consolidating statements — VIE column divided by consolidated total, third party revenues in the statement of operations [7] and balance sheet [8].
The shape of that chart is the finding. Everything a regulator or a nominee shareholder could physically interfere with — the licences, the brand, the customer receivables, the revenue — sits at the left. Almost none of the accumulated value does. Shareholders' equity in the VIE column is $84.0 million, 2.1% of the group's $3,974.7 million [9]; it was negative in both 2023 and 2024, minus $34.6 million and minus $36.7 million [10].
Two mechanisms produce that. The first is the service-fee sweep: the VIEs booked $658.0 million of intercompany costs against $1,509.9 million of third-party revenue in 2025 — 43.6% of their own top line paid out to Weibo Technology under agreements whose price Weibo Technology sets itself [11] [12]. The second is intercompany debt: of the VIEs' $2,094.8 million of liabilities, $1,398.3 million is owed to group companies [13]. The upstreaming route those flows take, and the tolls on it, is the subject of Claims on the Cash; the point here is the legal one. In a breach, the group would be pressing a creditor's claim and a share pledge against entities it does not own, not asserting title to $2.2 billion of assets.
Read against the refinancing the group faces, the same two mechanisms describe where the money is and who owns it. Up to $1,130 million of principal can fall due in 2027 at the Cayman parent, which held $302.9 million of the group's $2,405.1 million of liquid assets and has taken no subsidiary dividend since at least 2023, while $757.9 million of the group's $2,298.9 million of cash sat at 31 December 2025 inside contractually controlled entities that carry $84.0 million — 2.1% — of the group's $3,974.7 million of shareholders' equity and pay $706.4 million a year out to the WFOE as a service fee whose price the WFOE sets. [14]. The 2027 maturities are the $800 million still drawn under the 2022 term loan and the $330 million of 2030 Convertible Notes that holders may put on 6 December 2027 [15]; the service fee and the absence of any dividend to the parent since 2023 are set out in the cash-and-asset-flows table [16]. The remittance route and its tolls belong to Claims on the Cash; the ownership fact inside that arithmetic belongs here — the cash that would have to make the journey sits in entities the Cayman parent does not own.
Three of the four investment sleeves are outside the VIE box entirely. Of $1,663.3 million of long-term investments, $1,199.0 million sits in wholly owned subsidiaries and $75.1 million in Weibo Technology; only $389.3 million sits inside the VIEs [17]. That matters for the recovery arithmetic in What the Price Implies: most of the financial book a buyer is being asked to value is held through ordinary equity ownership, not through contracts.
Who is on the register
The equity of Weimeng is registered to four individuals — Yunli Liu (29.70%), Wei Wang (29.70%), Wei Zheng (19.80%) and Zenghui Cao (19.80%) — plus a 1% third-party holder. Weimeng Chuangke is registered 50/50 to Yunli Liu and Wei Wang [18]. The 20-F describes them as "PRC employees of us or SINA" and, in the loan agreements, as "not the controlling shareholders of SINA" [19] [20].
Two of those names appear elsewhere in the same document as senior management. Wei Wang has been Weibo's Chief Operating Officer since March 2021 and Zenghui Cao its Senior Vice President, Operation since April 2018 [21]; both hold personal Class A positions in the beneficial-ownership table (366,528 and 216,705 shares) [22]. Yunli Liu does not appear in Weibo's officer table, but he owns 30.0% of New Wave MMXV Limited, the British Virgin Islands vehicle that sits above SINA and therefore above Weibo — the second-largest economic interest in the control chain, behind Charles Chao's 61.2%, though all of New Wave's voting shares are Chao's [23]. The filing does not itself connect the Weimeng register to the officer table or to the New Wave notes; the names match across three sections of the same document.
The package binding those individuals runs to nine instruments: loan agreements, share transfer agreements, loan repayment agreements, an authorisation to exercise shareholder voting power, share pledge agreements, an exclusive technical services agreement, an exclusive sales agency agreement, a trademark licence agreement, and spousal consent letters [24]. The voting proxy is irrevocable and does not expire until Weimeng dissolves [25]; the pledges are registered with the administration for industry and commerce; each spouse has waived any claim on the shares [26]. Weimeng's arrangements date from 11 October 2010 with certain agreements added on 19 January 2018; Weimeng Chuangke's from 9 April 2014, with additions on 17 February 2020 [27].
The economics of the call option inside that package are worth setting out, because they are unusually explicit. Weibo Technology funded the individuals' capital injections with interest-free loans, outstanding at RMB555.0 million (US$79.4 million) to the Weimeng shareholders and RMB30.0 million (US$4.3 million) to the Weimeng Chuangke shareholders at 31 December 2025. The share transfer agreements let Weibo Technology buy their shares "at a purchase price equal to the amount of capital injection," and the loan repayment agreements provide that the loans are repaid only through share transfers, with the purchase price set off against the loan [28].
VIE third-party revenue 2025 ($M)
VIE shareholders equity ($M)
Contractual buy-out price ($M)
Disclosed fines 2018-2025 ($M)
Sources: VIE third party revenues and shareholders equity from the FY2025 20-F condensed consolidating statements [29] [30]; buy-out price derived as the sum of the RMB555.0 million and RMB30.0 million interest-free loan balances the share transfer price is set against [31]; fines derived from the penalty ledger below at the 20-F's RMB6.9931 convenience rate.
So the registered equity held by those individuals in a group that earned $143.3 million of net income in 2025 can be called for US$83.7 million, and that price is extinguished against money Weibo Technology has already advanced — a net cash cost of nothing. The qualification is stated in the same paragraphs, and it is narrower than it first reads: the shareholders must transfer their ownership to Weibo Technology "when permitted by PRC laws and regulations, or to our designees at any time for the amount of the outstanding loans," and the option itself may be exercised "at any time until it has acquired all shares of Weimeng, subject to applicable PRC laws" [32]. Those laws currently cap foreign ownership of an internet content provider at 50% [33]. The constraint therefore runs to who may take title, not to whether the option can be called: while the 50% cap stands, Weibo Technology cannot itself register as the holder, but the same clause lets the shares be called at any time in favour of a designee the group nominates — a PRC party that would hold them on the same terms, leaving the structure intact rather than dissolved.
What backs it instead is enforcement. All the agreements are governed by PRC law with disputes going to arbitration in China; the filing records that there are "very few precedents and little official guidance" on how VIE contracts should be interpreted, that arbitral awards can only be enforced through PRC court recognition proceedings, and that the arrangements "have not been tested in court to date" [34] [35]. PRC counsel, Kewei Law Firm, advises that the arrangements are valid, binding and enforceable [36]. The company's own risk language names the specific failure modes: the individuals may not act in the group's interest, and if a VIE were liquidated or declared bankrupt, or its assets became subject to third-party liens, "we may be unable to continue some or all of our business operations" [37].
The one percent outside the package
In April 2020 a third party, WangTouTongDa (Beijing) Technology Co., Ltd., invested RMB10.7 million for 1% of Weimeng's enlarged registered capital. That holder is not a party to any of the contractual arrangements. Its shares are not pledged, its votes are not assigned to Weibo Technology, and Weibo cannot compel it to sell. In exchange for 1% it holds a seat on Weimeng's three-member board and veto rights over certain content decisions and certain future financings of Weimeng [38].
Weibo's position is that it still controls Weimeng and remains its primary beneficiary under ASC 810-10-25-38A notwithstanding the 1% [39]. That is an accounting conclusion, and it is almost certainly right. It is a different statement from saying the entity is wholly controlled: one third of the board of the licence-holding entity, and a veto over its content decisions, sit with a counterparty the filing does not otherwise describe. The 20-F offers no information on WangTouTongDa's ownership, and no filing or call in this corpus adds anything to the 2020 disclosure.
The licence file
The permissions section is where the structure's practical cost shows up, and it has not moved in five years. Weimeng holds the Internet Content Provision Licence and the Online Culture Operating Permit; it also holds an inter-regional Value-Added Telecommunications Services Operating Licence for the provision of value-added telecommunication services nationwide [40] [41]. Two permits it does not hold are named in the same passage.
The first is the internet audio/video programme transmission licence. Weibo states that Weimeng "is not qualified to obtain" it under the current regime, because Circular 56 requires online audio/video providers to be wholly state-owned or state-controlled and Weimeng was not operating before that rule was issued [42]. This is not an application in a queue; the rule excludes the company that would have to make it. It has already had consequences: in 2018 and 2019 Beijing Integrated Law Enforcement on the Cultural Market issued three administrative penalties to Weimeng, each a warning and a RMB30,000 fine, for carrying on internet audio/video programme services without the licence, and in June 2017 the then broadcasting regulator publicly named Weibo among companies whose video and audio services should be suspended for the same reason [43].
The second is an internet publishing permit, which the company says "might be necessary" for its online game-related services and its user-generated content. The FY2021 20-F reported that Weimeng "has been actively communicating with the relevant regulator" for it; the FY2025 20-F reports that Weimeng "has been communicating with the regulator" for it [44] [45]. The same sentence, minus two words, appears in all five annual reports in this corpus. Value-added services — the games line included — were $255.6 million of FY2025 revenue [46]; the stated consequence of providing online publishing services without the permit runs to removal of the publications, confiscation of illegal income, fines and closure of the websites [47].
The enforcement record, priced
The whole disclosed penalty history of the group across eight years fits in one table.
Sources: 2018-2019 audio/video penalties, FY2021 20-F [48]; June 2020 and September 2025 content penalties, FY2025 20-F [49]; 2020 advertising penalties, FY2022 20-F [50]; anti-monopoly penalties, FY2025 20-F [51]; the dates and the acquisitions behind each anti-monopoly decision, FY2025 20-F [52].
The monetary total is RMB2.22 million, about US$0.32 million at the 20-F's RMB6.9931 convenience rate — 0.07% of a single year's operating income, spread over eight years. The confiscated advertising income attaching to one 2020 penalty is not quantified, so the true figure is slightly higher. No advertising penalty was received in 2023, 2024 or 2025 [53].
Two things follow. The first is that Chinese content regulation has never reached Weibo through its wallet. The item in that table with real economic content is non-monetary: one week with Hot Search switched off in June 2020 [54]. Hot Search is the discovery surface Industry describes as the platform's distinctive asset, and its suspension is the sanction that would show up in a quarter's revenue. The September 2025 penalty was aimed at the same product, at RMB100,000 [55].
The second is that the ceilings have moved and the realised record has not. The amended Cyber Security Law, effective 1 January 2026, raises the maximum fine for failing to remove prohibited information to RMB10 million, with RMB2 million to RMB10 million available where consequences are particularly serious, alongside suspension of operations, shutdown of applications or revocation of permits, and personal fines of up to RMB1 million on responsible individuals [56]. Weibo's own risk heading now quantifies the exposure as fines of up to RMB10 million under the Cyber Security Law or up to RMB50 million or 5% of prior-year turnover under the Personal Information Protection Law [57]. Five per cent of FY2025 revenue is $87.9 million. Realised penalties over eight years total US$0.32 million; the statutory ceiling now disclosed is $87.9 million, about 275 times that.
Notably, three of the seven penalties were levied on Weimeng Chuangke for making acquisitions without filing them for merger review — the investment vehicle whose seven-year record is the subject of The Investing Record. The compliance failure and the capital-allocation record point at the same entity.
The audit and filing channels
Two mechanisms could sever the chain without any Chinese authority touching the VIE contracts at all.
The first is the Holding Foreign Companies Accountable Act. After the PCAOB's December 2021 determination that it could not fully inspect mainland China and Hong Kong audit firms, the SEC conclusively listed Weibo as a Commission-Identified Issuer in April 2022; the PCAOB vacated that determination on 15 December 2022, and Weibo has not been identified since. The determination is remade annually, and two consecutive identifications would trigger a trading prohibition [58]. This is a live, dated, annually reset condition rather than a background risk, and Weibo has already been on the wrong side of it once.
The second is the CSRC filing regime. Since 31 March 2023, overseas offerings and listings by PRC-domiciled groups — including follow-on offerings, convertible bonds and exchangeable bonds — require a filing with the CSRC. Weibo completed one after issuing the 2030 Convertible Notes [59]. That is a completed precedent rather than an open question, but it means the equity-linked half of any refinancing of the 2027 maturities described in Claims on the Cash runs through a Chinese regulatory gate as well as a market one.
A third channel is quieter. The 20-F warns that if PRC tax authorities found the VIE service-fee pricing not to be arm's length, they could adjust Weimeng's taxable income upward, impose late-payment penalties, and cause Weibo Technology to lose its preferential tax treatment [60]. The service fees at issue were $757.8 million, $769.0 million and $706.4 million across 2023 to 2025 [61], and the preferential treatment at risk is the high and new technology enterprise status that reduced Weibo Technology's tax by $30.9 million in 2025, down from $42.2 million in 2023 [62].
None of this appears in the call record. The terms "VIE" and "variable interest entity" occur in none of the sixteen indexed transcripts from Q2 2021 to Q1 2026, from management or from any analyst. The structure is disclosed exhaustively once a year and discussed never.
Insider ownership through the chain
For a reader weighing alignment, the ownership picture at each level of the chain reads differently.
At the top, insiders' personally held economics are small and the large attributed percentages are SINA's Class B control block rather than shares any officer bought; the control map, the March 2025 pledge of half that block and the option and RSU record behind those numbers are set out in People.
At the bottom of the chain the arithmetic runs the other way. Wei Wang and Zenghui Cao hold 583,233 Class A shares between them — 0.24% of the company — against 49.5% of Weimeng's registered equity, and in Wei Wang's case 50% of Weimeng Chuangke's [63] [64]. Yunli Liu holds no disclosed Weibo shares but 30.0% of New Wave MMXV; on a look-through through SINA's 35.7% block [65], that is an indirect interest of roughly 10.7% in Weibo's economics — larger than any officer's direct position, and attached to non-voting shares [66]. The fourth registrant, Wei Zheng, appears nowhere else in Weibo's disclosure at all.
So the honest answer to whether insider ownership here is strong is that it is concentrated and it is not bought. Alignment runs through SINA's control block, through employment, and through a set of contracts that has never been enforced — not through capital that insiders put at risk in the market.
What would change the read
The read this chapter reaches is narrow. The tail risk of the PRC disallowing VIE structures cannot be priced from any document in this corpus, and pretending otherwise would be false precision. Three things in it can be observed.
The structure's realised cost has been trivial and its documented control is thorough — an irrevocable proxy, registered pledges, spousal consents, fifteen years without a disclosed dispute, and a design that leaves only 2.1% of consolidated equity inside the entities at issue. Set against that, the option that would end the arrangement can only be called in favour of a PRC designee rather than the group itself, one third of the licence-holding entity's board belongs to an undescribed third party, and a permit the company says it might need has been "in communication" with its regulator across five consecutive annual reports.
Three specific developments would move it. A PCAOB re-determination on mainland China and Hong Kong audit firms would restart the HFCAA clock and would matter more in 2027, when refinancing is due, than it did in 2022. A second Hot Search suspension, or any enforcement action naming Weimeng's licence gaps rather than its content, would convert a disclosure item into a revenue item; the amended Cyber Security Law gives the authorities, from 1 January 2026, a fine ceiling twenty times the largest penalty ever levied on the company. And any change in the Weimeng register — a name added, removed or replaced — would be the first observable evidence in fifteen years about how the group handles the individuals whose signatures hold the structure together.
The Investing Record
Between 2019 and 2025 Weibo put $2,244.2 million of net cash into its long-term investment book — 49% of the operating cash it generated over those seven years, and 3.5 times what it returned to shareholders. Across the same period the four investment lines in its income statement recorded a cumulative pre-tax loss of $681.0 million. Two of the larger purchases were made from the controlling shareholder, and $230.7 million of what was paid never became an asset at all.
Net cash into investments, 2019-2025
Cumulative pre-tax investment loss
Dividends plus buybacks, 2019-2025
Charged to paid-in capital on two SINA purchases
Sources: derived from the consolidated statements of cash flows in the FY2025 20-F for 2023-2025 [1], the FY2022 20-F for 2020-2022 [2] and the FY2021 20-F for 2019 [3]; investment result from the consolidated statements of comprehensive income in the FY2025 [4], FY2022 [5] and FY2021 [6] 20-Fs; equity charges from the FY2023 [7] and FY2022 [8] 20-Fs.
Where the operating cash went
Weibo's cash-flow statement separates the money that funds the platform from the money that funds the portfolio. The first is small: $275.4 million of capital expenditure across seven years, under 2.5% of revenue in most of them. The second is large. The line the company labels investment in and prepayment on long-term investments — which carries its equity stakes, its deposits and prepayments, and its loans to investees — absorbed $3,661.8 million gross and returned $1,417.6 million, for a net $2,244.2 million [9] [10] [11]. That is 8.1 times what the operating business spent on itself.
Sources: consolidated statements of cash flows, FY2025 20-F for 2023-2025 [12], FY2022 20-F for 2020-2022 [13] and FY2021 20-F for 2019 [14]. Net investments are purchases less disposals and refunds on the long-term investment line; shareholder returns are dividends paid plus share repurchases.
The concentration matters as much as the total. Two years carry most of it: $628.6 million net in 2019 and $1,146.5 million net in 2021. Deployment then collapsed — a combined $59.2 million net across 2024 and 2025, with 2024 a net inflow. Distributions started at the other end of the record: the first buyback in 2022, the first dividend in 2023. Over the full seven years $647.9 million reached shareholders against $4,583.6 million of operating cash flow, a payout of 14.1%. The portfolio took 49.0%.
What the book has earned
The income statement carries four lines that report on that book: equity-method results, realised gains, fair-value changes, and impairment. Summed across 2019 to 2025 they come to a pre-tax loss of $681.0 million.
Sources: consolidated statements of comprehensive income, FY2025 20-F for 2023-2025 [15], FY2022 20-F for 2020-2022 [16] and FY2021 20-F for 2019 [17].
All figures US$ millions. Sources as above: FY2025 20-F [18], FY2022 20-F [19], FY2021 20-F [20].
Impairment is the dominant line: $762.8 million charged across the seven years, and in only one of them ($6.0 million in 2025) below $23 million [21] [22] [23]. The named write-offs read as a list of the last decade's Chinese internet enthusiasms: a $75.3 million full impairment of Yixia Tech in 2021 [24], a $15.9 million write-off on an online education company in 2023, a $30.0 million impairment on a US-based maker of hydrogen-powered autonomous trucks in 2024, a $3.7 million write-off on an online literature business in 2025 [25].
A separate book has done better. Interest income totalled $712.3 million across the same seven years against $537.8 million of interest expense, a net $174.5 million [26] [27] [28]. That is the treasury operation — deposits, wealth management products and the rolling credit examined in Claims on the Cash — and it is not the same activity as the equity portfolio. Netting the two still leaves the financial side of Weibo about $506 million behind over seven years, before tax and before the funding cost of holding the assets.
The strongest fact running the other way sits in the most recent year. FY2025's investment lines produced a gain of $92.5 million, the best of the seven, and 2023 produced $32.0 million. Two positive years in three is a genuine change in direction, and the impairment charge in 2025 was the smallest on record.
The marks on what is left
The residue of $2.24 billion of net deployment is a long-term investment balance of $1,663.3 million at 31 December 2025, in three sleeves that carry very different levels of evidence [29].
The privately held sleeve is marked at cost less impairment plus observable price changes, and the company discloses the running total. Against an initial cost basis of $824.3 million there are $92.7 million of cumulative upward adjustments and $624.4 million of downward ones, leaving $291.7 million — 35 cents on the dollar of what was paid [30].
Source: FY2025 20-F, Note 4 Long-term Investments, cumulative adjustments to the initial cost basis of equity securities without readily determinable fair values [31].
The marketable sleeve is one holding: Didi, cost $142.0 million, fair value $158.1 million at 31 December 2025, a gain of 11% on cost [32]. The equity-method sleeve is the largest at $1,213.6 million and carries no mark at all — it is cost plus accumulated share of investee earnings, and the filing gives no fair value for it [33].
One piece of that sleeve is observable, because it trades. Weibo holds 480,342,364 shares of INMYSHOW Digital Technology, 26.57% of a Shanghai-listed company (SSE: 600556) [34]. INMYSHOW closed at RMB5.12 on 10 August 2026, capitalising the company at RMB9.26 billion on third-party market data, which values Weibo's stake at about RMB2.46 billion, or roughly $352 million at the RMB6.9931 convenience rate the 20-F uses. Weibo recognised the position at $384.2 million when it moved to equity-method accounting in March 2023 — $153.4 million of reclassified existing holding plus $230.8 million of newly acquired shares [35] [36]. The block bought in 2023 cost RMB2.16 billion for 332,615,750 shares, or RMB6.49 each, against RMB5.12 today — down 21% [37]. Weibo does not disclose the stake's current carrying value, so the comparison is against inception, not against today's book.
The FY2025 equity pick-up deserves a second look for the same reason. The $76.7 million of equity-method income is the single largest positive item in the seven-year record and 12.7% of FY2025 pre-tax profit [38]. It did not come from INMYSHOW, which reported revenue of RMB3.90 billion and net income of RMB30.87 million for 2025 on third-party data — Weibo's 26.57% of that is roughly RMB8 million, near $1 million. The 20-F's aggregated investee data points the same way: across all equity-method holdings, revenue of $724.6 million produced income from operations of $261.5 million, more than the $248.7 million of gross profit those investees earned [39]. Operating income above gross profit is the signature of investment vehicles marking their own holdings up, not of a business trading well. The aggregate swung from a $72.2 million net loss in 2024 to $226.2 million of net income in 2025 [40]. Cash told a quieter story: dividends received from equity-method investees were $8.5 million [41].
Two purchases from the controlling shareholder
The two largest transactions of the record were both with SINA, and both were accounted for as transfers between entities under common control. Under ASC 805-50 the buyer records what it receives at the seller's carrying value and charges the excess price to equity — so neither transaction produced an asset equal to what was paid, and neither will ever run through the income statement.
In December 2022 Weibo Hong Kong agreed to buy 100% of Sina.com Technology (China) Co., Ltd., which owns the SINA Plaza office building in Beijing, for approximately RMB1.5 billion [42]. STC's assets came across at a carrying value of $340.5 million and its liabilities at $281.1 million, and the $159.0 million difference between the price and those net assets was recognised in additional paid-in capital as a distribution [43]. The equity statement shows it as a single line, Acquisition of Sina.com Technology (China) Co., Ltd, of $(159,028) thousand [44].
Three months later, in March 2023, Weibo's Singapore subsidiary bought ShowWorld HongKong Limited from an indirect SINA subsidiary for approximately RMB2.16 billion in cash. The only asset ShowWorld HongKong held was 332,615,750 INMYSHOW shares [45] [46]. Those shares were recorded at SINA's carrying value of $230.8 million, and the difference was again charged to additional paid-in capital as a distribution [47]. The FY2023 equity statement quantifies it — Changes due to investment in INMYSHOW, $(71,695) thousand [48].
Sources: FY2022 20-F consolidated statements of shareholders' equity [49] and Note 6 [50]; FY2023 20-F consolidated statements of shareholders' equity [51].
The $230.7 million is not an accounting artefact to be waved through. It is cash that left the company, was paid to its controlling shareholder, and bought no recognised asset — 35.6% of everything Weibo returned to its own shareholders across the seven years, and $0.94 per share against the 245,549,858 shares outstanding at the end of 2025 [52]. Because the charge lands in equity rather than in earnings, it appears in no margin, no earnings-per-share figure and no non-GAAP reconciliation.
The counter-case is real and should be stated with it. Common-control accounting is mandatory, not elective: ASC 805-50 gives the buyer no choice about recording the assets at the seller's basis, and a charge to paid-in capital is the prescribed treatment rather than a way of hiding a cost. Both prices were disclosed in advance and in RMB, both transactions were described in the risk factors and the property section, and in the SINA Plaza case Weibo bought a building it was already occupying and paying SINA rent for — the FY2022 filing states that no further SINA Plaza rental expense would be allocated to Weibo from 2023 [53]. What the accounting does not tell a reader is whether either price was the price an unrelated buyer would have paid, and no filing in the record contains an independent fairness opinion on either.
Property inside the financial book
Three separate disclosures place a meaningful share of the balance sheet in Chinese commercial real estate, none of them obviously connected when read alone.
Sources: FY2025 20-F Note 10 Related Party Transactions for the Company B balance [54]; Note 8 Other Balance Sheets Components for the deposit transfer and the office building [55].
The first is the $408.3 million of loans to Company B, described only as "an investee in real estate business," examined in Claims on the Cash. The second is a deposit: Weibo held $154.0 million at the end of 2023 for equity interest in a holding company over a commercial property, wrote $49.0 million off it in 2024 for "increased valuation uncertainty… associated with the extended transaction timeline," and carried $87.6 million at the end of 2024 [56] [57]. During 2025 the transaction closed: $72.4 million of investment-related deposits, together with $35.1 million of investment prepayment, moved into equity-method long-term investments [58]. That conversion is why 2025's equity-method additions of $186.0 million so far exceed the $110.1 million of cash that actually left the company for long-term investments that year [59] [60]. The third is SINA Plaza itself, $193.5 million of office building within gross property and equipment [61].
Together that is roughly $674 million, about 17% of the $3.94 billion of financial assets net of debt that the price arithmetic in What the Price Implies turns on. It is the part of the book whose recovery is least likely to track the platform's own fortunes, and the one item in it that has already been marked — the property deposit — was marked down 32%.
Absent from the calls
Across the sixteen indexed earnings-call transcripts, from Q2 2021 to Q1 2026, the words INMYSHOW, SINA Plaza, Didi, long-term investment, equity method and impairment do not appear once, from management or from any analyst. A book that has absorbed half the operating cash of seven years, and that the current share price depends on more than it depends on advertising, has never been discussed on a public call in this record. The one adjacent subject that does come up is wealth management products, in the CFO's routine recitation of the cash balance.
That silence is a disclosure fact, not a motive. Weibo files a 20-F rather than a 10-Q, holds one call a quarter with a handful of covering analysts, and answers what is asked. But it means the investment book is knowable only from the filings, and the filings identify most of its contents by description — "an investee providing online brokerage services," "an investee in real estate business," "a media company focusing on providing financial information" — rather than by name [62] [63].
What would change the read
The record supports a specific and limited conclusion: as a capital allocator away from its own platform, Weibo has destroyed value — $681.0 million of cumulative pre-tax losses on $2,244.2 million of net deployment, plus $230.7 million paid to the controlling shareholder above the carrying value of what came back. That is a judgment about seven years of history, not a forecast, and it is worth separating from the operating business, which converted revenue to cash at 27% of sales in the same year the portfolio finally turned positive.
Three things would move it. The first is sustained positive investment results: 2023 and 2025 were both profitable years on these lines, and a third would suggest the 2019–2022 write-off cycle was a vintage problem rather than a process problem. The second is disclosure of a mark — an INMYSHOW carrying value, a named investee, a secondary sale at a stated price — which would replace the widest assumption in the valuation with a number; the equity-method sleeve is $1,213.6 million and carries no fair value at all. The third is the direction of new deployment. Net investment has run at $59.2 million combined across 2024 and 2025 against $390.0 million of distributions in those two years, which is the reverse of the 2019–2021 pattern. If that holds, the seven-year record above describes a policy the company has already left behind; if a single large purchase resumes it, the record is the better guide.
What the Price Implies
At $7.94 on 7 August 2026, Weibo's market capitalisation is $2.13 billion. Its own balance sheet carries $5,807.7 million of cash, investments, deposits and loans against $1,863.6 million of debt — $3,944.2 million net, or roughly twice the whole market value. Crediting that book at nothing, the price is 4.6 times the cash the advertising business generates by itself. What follows sets out what recovery on those financial assets, and what rate of decline in the operating business, the price is consistent with.
The price and the share count behind it
Weibo had 245,549,858 ordinary shares outstanding at 31 December 2025 — 157,727,834 Class A and 87,822,024 Class B [1]. At $7.94 that is $1,949.7 million of equity value. The $2.13 billion market capitalisation quoted above rests instead on the 268,560 thousand diluted shares used in reported earnings per share, a count that sits 23.0 million above the shares actually issued because the 2030 Convertible Notes are treated as converted [2]. Those notes convert at 72.6929 ADSs per $1,000 of principal, about $13.76 per ADS [3], so at $7.94 they are debt in substance and cash in prospect — the reason the maturity schedule in Claims on the Cash treats the December 2027 put as a cash obligation. Both counts appear below where they matter; the choice does not change any conclusion, because it moves the equity value and the debt figure in the same direction.
Market Capitalisation (US$m)
Trailing FCF Yield
Price / Book
Dividend Yield
Sources: market capitalisation and trailing free-cash-flow yield from reported financials at the 7 August 2026 close; book value of $3,920.7 million and the balance-sheet inputs from the FY2025 Form 20-F, Consolidated Balance Sheets [4]; dividend of US$0.61 per share declared in March 2026 [5].
Book value per share is $15.97 on the $3,920.7 million attributable to Weibo's shareholders, so the shares change hands at roughly half of stated book [6]. Reported earnings give a trailing multiple of 4.7 times the $1.70 of FY2025 diluted earnings per share [7], and that multiple is the least reliable of the three. FY2025 net income carried a $76.7 million pick-up from equity-method investees and $21.3 million of fair-value gains; one quarter later the same lines ran the other way — a $35.0 million fair-value loss and $22.1 million of equity pick-up losses cut net income attributable to shareholders to $34.7 million from $107.0 million, and diluted earnings per share to $0.14 from $0.41, while income from operations was flat at $110.9 million [8]. A price-to-earnings ratio on this company is in large part a ratio on the investment portfolio's mark for the period.
Two balance sheets, one price
The more informative decomposition separates the assets that produce advertising revenue from the assets that produce interest, dividends and marks. Nine lines on the FY2025 balance sheet are financial rather than operating.
Sources: cash, short-term investments, amount due from SINA, long-term investments and the three debt lines from the FY2025 Form 20-F, Consolidated Balance Sheets [9]; wealth management products, related-party and third-party loans from the balance-sheet components note [10]; equity value derived from 245,549,858 shares at the 7 August 2026 close.
The debt figure is the sum of $745.6 million of unsecured senior notes, $323.9 million of convertible senior notes and $794.0 million of long-term loans, all of them carried at the Cayman parent [11]. Netting it against the financial assets at face value leaves $3,944.2 million, or $16.06 per share against a $7.94 quote. The residual line is what remains for a business that earned $464.8 million of operating income on $1,757.2 million of revenue in FY2025 [12]: negative $1,994.5 million.
Face value is the wrong mark, and the reconciliation in Claims on the Cash is why. Of that book, $946.0 million is credit extended to related parties rather than cash held, $620.5 million sits in wealth management products, and $1,663.3 million is a long-term investment portfolio whose measurement-alternative sleeve is already carried far below cost. More constraining still, the cash is in the wrong entity: the parent that owes every dollar of the debt held $286.4 million of cash and $16.5 million of short-term investments at year-end, against group cash of $2,298.9 million [13]. Moving money out of China costs at least the 5% treaty withholding rate, and the 20-F's own illustration shows RMB100 of pre-tax earnings inside the VIEs reaching a shareholder as 67.5 [14]. Financial assets that stay inside the onshore entities contribute their interest income to consolidated earnings; they do not reach an outside holder at carrying value.
Solving for the assumption
The useful move is to treat the recovery rate on that financial book — whose seven-year deployment record and marks are set out in The Investing Record — as the unknown, and read off what the price implies for the operating business at each level. The operating business's own cash generation comes from stripping the financial income out of free cash flow: FY2025 free cash flow of $477.1 million, less $116.8 million of interest income and $8.5 million of dividends received from equity-method investees, plus $75.3 million of cash interest paid on the debt that is being netted separately, gives roughly $427 million [15] [16]. That is an approximation before tax effects: the interest income removed was taxed and the interest expense added back was deductible, and the two are close enough in size that the residual error is small against the ranges below.
Source: derived from the FY2025 balance sheet and cash-flow statement [17] [18], at a market value of equity of $1,949.7 million.
Two readings follow. Writing the entire $3.94 billion down to zero — every dollar of onshore cash, every loan to SINA, the whole investment portfolio, with the debt still repaid in full — still leaves an operating business bought at 4.6 times its own annual cash generation. Crediting the book at 50 cents on the dollar leaves the operating business at approximately nothing. Across the plausible range there is no recovery assumption at which the price looks demanding on FY2025 numbers.
The operating business on its own terms
That leaves the second variable: what a flat-to-declining annuity is worth. The advertising base has not grown since 2019 and the arithmetic of its slope is set out in Advertising Base; consensus has FY2026 revenue growth at 2.6% and a forward free-cash-flow yield of 18.0%. The table below prices a perpetuity at a range of discount rates and constant decline rates, for comparison with the 4.6 times paid at zero recovery.
Source: derived, as the reciprocal of the discount rate plus the decline rate; the cash-flow base is the US$427 million computed above from the FY2025 cash-flow statement [19].
At a 12% discount rate, 4.6 times corresponds to a perpetual decline of about 10% a year; at 15%, about 7%. Weibo's advertising revenue excluding Alibaba fell 3.9% in FY2025, from $1,381.9 million to $1,327.8 million [20], and by low single digits in each of the two years before that [21]. The price at zero recovery therefore embeds a faster erosion than the company has yet delivered, and does so while assuming the entire financial book is worthless.
The read this supports: the shares are priced for a combination of outcomes — near-total impairment of the financial assets together with an acceleration of the advertising decline — that the FY2025 record does not show. The strongest fact against it is that neither leg has to be literally true for the price to be right. If the onshore cash and the related-party loans are never distributed and never realised by an outside holder, their worth to that holder approaches zero regardless of carrying value; and a business whose average daily users fell from 260 million in December 2024 to 252 million in December 2025 [22], on a margin that is drifting, can compound toward a high-single-digit revenue decline without any single dramatic year. What would change the read in either direction is observable: execution of the buyback, a refinancing of the 2027 maturities that does not consume the offshore pocket, and two consecutive quarters of positive constant-currency advertising growth without an event base.
What has actually reached shareholders
Between 2023 and 2025 Weibo paid out $200.1 million, $194.4 million and $195.6 million in dividends [23], and in 2026 a further $150 million on the $0.61 per share declared in March [24]. Four declarations of $0.85, $0.82, $0.82 and $0.61 total $3.10 per share — 39% of the current price, returned in four years [25].
Sources: cash dividends paid for 2023-2025 from the FY2025 Form 20-F, Consolidated Statements of Cash Flows [26]; the 2026 figure from the Q1 2026 earnings call [27].
The trend in that series is the more important fact. The 2026 declaration is 26% below each of the prior three, in a year when free cash flow was $477.1 million and the payout absorbed under a third of it. Set against the parent-level maturities, the cut reads as a decision about the offshore pocket rather than about earnings.
The repurchase record cuts against the value case more directly. The board authorised $200 million in December 2025, running to 31 December 2026, and the 20-F states plainly that no shares were repurchased in 2025 [28]. At $7.94, $200 million would retire roughly 25.2 million shares, 10.3% of the count. The precedent is not encouraging: the previous programme, authorised at $500 million in March 2022, spent $57.7 million buying 3,055,759 ADSs at an average of $18.88 before lapsing [29]. The company bought at $18.88 and has bought nothing at $7.94. Asked in March 2025 how it thought about shareholder returns, the CFO named two principles — driving business growth and staying competitive, and enhancing shareholder returns — and said the company was open to other measures such as buyback [30]. The authorisation followed nine months later; no execution has been disclosed in the record to August 2026. Nor has any insider bought in the open market, a point the People record sets out in full.
Nasdaq closes reported in the 20-F itself run $9.55 at end-2024 and $10.22 at end-2025 [31], against $7.94 in August 2026 and a mean sell-side target of $9.04 across sixteen analysts. The discount has widened while the operating numbers were roughly flat.
Against the listed peers
Weibo is inexpensive relative to the listed peers named in its own filings [32] [33], not only relative to its history.
Source: third-party market data as at 10 August 2026, not from company filings; iQIYI is omitted, having no meaningful trailing multiple. Earnings quality differs across the group — Weibo's denominator carries the investment-portfolio marks described above.
The comparison is indicative rather than decisive: none of these companies runs an identical model, as the peer caveats in Competition set out, and a trailing multiple on Weibo's reported earnings inherits all the volatility of its equity-method book. The narrower point survives those caveats — the discount is not a China-listing discount alone, since Autohome and Hello Group face the same jurisdiction and trade at 16.8 and 9.2 times earnings against Weibo's 5.6.
What would move the range
Four things carry most of the movement, each observable in a filing.
The 2027 maturities. Up to $1,130 million of principal can fall due in 2027 [34] against $302.9 million of liquid assets at the parent [35]. A refinancing on terms that leaves the offshore pocket intact removes the largest single reason to haircut the financial book; funding it by upstreaming, at the 5% withholding toll, quantifies the leakage instead.
Buyback execution. A disclosed repurchase converts the $200 million authorisation from an intention into per-share arithmetic, and at the current price it is the most accretive use of offshore cash available to the company.
The advertising slope. The perpetuity table is most sensitive to the decline rate: the difference between a flat base and a 5% annual decline at a 12% discount rate is 8.3 times against 5.9 times — a swing of about $1.0 billion on $427 million of cash flow, roughly half the current market value.
The tax base. Preferential treatments — high and new technology enterprise status and the research-and-development super-deduction — were worth $37.0 million in FY2025, an effect of $0.15 on basic earnings per share [36], and the filing notes the preferential rate is temporary in nature and subject to qualification [37].
Trailing free cash flow was $477.1 million in FY2025 and, across the last four reported quarters, roughly $525 million: first-quarter 2026 operating cash flow of $164.0 million less $11.9 million of capital expenditure, against $113.2 million and $9.4 million in the comparable quarter. The cash generation has not yet turned down.
Sources: Q1 2026 and Q1 2025 unaudited results [38] [39]; FY2025 free cash flow from the Consolidated Statements of Cash Flows [40].
Limits of this arithmetic
Three are worth naming. The perpetuity grid is a comparison device, not a model: it holds the decline rate and the margin constant, and Weibo's operating margin has moved from 26.9% to 28.2% and back to 26.5% across the last three years. The recovery table nets financial assets against debt as though both sat in one place, which the parent-versus-group split shows they do not — a more exact treatment would discount the onshore assets for time and tax while holding the parent's obligations at par, which pushes every recovery figure lower. And none of this rests on a control premium or a take-private: the voting structure documented in People means closing any discount is not a decision an outside shareholder can force.
The numbers behind Weibo Corporation: as-reported financial statements and company metrics for FY2021–FY2025, traced to the source filings, opened with the share-price history those statements have to justify. Every linked figure opens the exact page of the filing it was printed on, with the statement row highlighted. Amounts in US$ thousands unless noted.
Reading notes: Weibo reports in U.S. dollars; all figures are as printed in the filings, in thousands of U.S. dollars (per-share amounts in dollars, share counts in thousands). FY2023-FY2025 income-statement and cash-flow figures are the three comparative columns of the FY2025 Form 20-F; FY2022 comes from the FY2022 Form 20-F and FY2021 from the FY2021 Form 20-F. Balance-sheet columns are taken from each year's own Form 20-F. FY2019 and FY2020 long-term figures are comparative columns of the FY2021 Form 20-F; FY2016-FY2018 come from the standardized data feed (SEC XBRL) and are shown without page links, as is FY2019 shareholders' equity (the FY2021 Form 20-F balance sheet presents only 2020 and 2021). The income statement omits one line the filings print only in FY2022 - 'Impairment of intangible assets' of US$10,176 thousand - so for FY2022 the four expense captions shown sum to US$1,345,688 thousand against printed total costs and expenses of US$1,355,864 thousand. No sum check is attached to that row for this reason.
Share Price — Available History Since March 2026
The stock closed at $7.94 on Aug 07, 2026 — down 9% over the window shown, trading between $7.20 and $9.27. At that close the stock trades at 4.7× FY2025 diluted EPS as reported below.
Source: market price feed, daily closes, Mar 2026–Aug 2026 — the feed marks this available history as partial. Price return only, excludes dividends.
Market capitalization $2.1bn.
Market cap = 268.6M shares outstanding × the Aug 07, 2026 close of $7.94. Market-derived, shown without filing links.
FY2025 at a Glance
Revenue (US$ thousands)
Net income (US$ thousands)
Diluted EPS
Source: FY2025 consolidated statements [1] [2] [3]. Click any linked figure to open the filing page with the row highlighted.
Revenues by Type
| Revenues by Type | FY2021 | FY2022 | FY2023 | FY2024 | FY2025 |
|---|---|---|---|---|---|
| Third parties | 1,633,242 | 1,392,723 | 1,344,354 | 1,315,055 | 1,289,273 |
| Alibaba | 181,241 | 107,197 | 111,608 | 116,785 | 173,834 |
| SINA | 96,359 | 56,206 | 45,319 | 25,022 | 14,311 |
| Other related parties | 69,953 | 40,524 | 32,733 | 41,831 | 24,212 |
| Advertising and marketing revenues | 1,980,795 | 1,596,650 | 1,534,014 | 1,498,693 | 1,501,630 |
| Value-added services revenues | 276,288 | 239,682 | 225,822 | 255,984 | 255,586 |
| Total revenues | 2,257,083 | 1,836,332 | 1,759,836 | 1,754,677 | 1,757,216 |
| Total revenues growth, derived | — | -18.6% | -4.2% | -0.3% | +0.1% |
Source: Form 20-F Consolidated Statements of Comprehensive Income - revenue disaggregation as reported (advertising and marketing revenues split by counterparty, plus value-added services) [1] [2] [3]. Click any linked figure to open the filing page with the row highlighted.
Income Statement
Source: Form 20-F Consolidated Statements of Comprehensive Income [1] [2] [3]. Click any linked figure to open the filing page with the row highlighted.
Columns marked E are consensus analyst estimates from S&P Capital IQ (CapIQ), shown alongside reported results for direct comparison; they are not company guidance.
Estimate source: S&P Capital IQ (CapIQ) consensus, as of 2026-08-10. Estimate figures are S&P Capital IQ consensus (vendor data — no filing page links). EPS and net income use the normalized (adjusted) consensus where the street reports it. Line-item analyst models (segments, drivers, KPIs) are in the Visible Alpha tab.
Balance Sheet
Source: Form 20-F Consolidated Balance Sheets [4] [5] [6] [7]. Click any linked figure to open the filing page with the row highlighted.
Cash Flow
| Cash Flow | FY2021 | FY2022 | FY2023 | FY2024 | FY2025 |
|---|---|---|---|---|---|
| Net income | 411,877 | 97,809 | 357,495 | 310,105 | 461,075 |
| Depreciation and amortization | 55,008 | 54,694 | 58,509 | 58,137 | 59,088 |
| Stock-based compensation | 87,996 | 111,713 | 101,131 | 69,714 | 42,067 |
| Net cash provided by operating activities | 814,020 | 564,104 | 672,820 | 639,898 | 519,479 |
| Purchases of property and equipment | (35,094) | (43,136) | (36,772) | (61,469) | (42,368) |
| Investment in and prepayment on long-term investments | (1,593,880) | (193,784) | (602,740) | (79,804) | (110,139) |
| Net cash provided by (used in) investing activities | (423,960) | (33,014) | (736,846) | (246,900) | 66,617 |
| Dividends paid to shareholders, net of dividends received from ADS borrower | — | — | (200,131) | (194,401) | (195,644) |
| Net cash provided by (used in) financing activities | 189,442 | (91,141) | 21,690 | (1,029,439) | (227,293) |
| Effect of exchange rate changes on cash and cash equivalents | 29,357 | (172,884) | (63,797) | (57,562) | 49,506 |
| Net increase (decrease) in cash and cash equivalents | 608,859 | 267,065 | (106,133) | (694,003) | 408,309 |
| Cash and cash equivalents at the end of the year | 2,423,703 | 2,690,768 | 2,584,635 | 1,890,632 | 2,298,941 |
| Free cash flow, derived | 778,926 | 520,968 | 636,048 | 578,429 | 477,111 |
Source: Form 20-F Consolidated Statements of Cash Flows [8] [9] [10]. Click any linked figure to open the filing page with the row highlighted.
Advertising Monetization
| Advertising Monetization | FY2021 | FY2022 | FY2023 | FY2024 | FY2025 |
|---|---|---|---|---|---|
| Total number of advertisers | 1,000,000 | 1,000,000 | 700,000 | 600,000 | 400,000 |
| Average spending per advertiser, excluding Alibaba (US$) | 1,860 | 1,552 | 2,142 | 2,438 | 3,385 |
| Revenues from advertisers contracting directly | 478,874 | 356,503 | 437,276 | 487,306 | 559,339 |
| Revenues from advertising agencies | 1,501,921 | 1,240,147 | 1,096,738 | 1,011,387 | 942,291 |
| Top 10 advertising agencies, share of total revenues | 35% | 42% | 37% | 35% | 32% |
| Mobile advertising revenues, share of advertising and marketing revenues | 93% | 94% | — | — | — |
Source: company filings [11] [12] [13] [14]. Click any linked figure to open the filing page with the row highlighted.
Non-GAAP Results as Reported
| Non-GAAP Results as Reported | FY2021 | FY2022 | FY2023 | FY2024 | FY2025 |
|---|---|---|---|---|---|
| Non-GAAP income from operations | — | 601,100 | 592,100 | 584,100 | 523,600 |
| Non-GAAP operating margin | — | 33% | 34% | 33% | 30% |
| Non-GAAP net income attributable to Weibo's shareholders | — | 540,100 | 450,600 | 478,600 | 439,800 |
| Non-GAAP diluted net income per share | — | 2.27 | 1.88 | 1.82 | 1.65 |
Source: company filings [15] [16] [17] [18]. Click any linked figure to open the filing page with the row highlighted.
Non-Operating Income and Investment Charges
| Non-Operating Income and Investment Charges | FY2021 | FY2022 | FY2023 | FY2024 | FY2025 |
|---|---|---|---|---|---|
| Interest income | 77,280 | 105,434 | 118,209 | 123,336 | 116,826 |
| Interest expense | (71,006) | (71,598) | (120,070) | (105,397) | (82,442) |
| Investment related impairment and provision | (106,800) | (71,081) | (23,642) | (93,382) | (5,972) |
| Fair value changes through earnings on investments, net | (72,787) | (243,619) | 43,002 | 18,564 | 21,258 |
Source: company filings [19] [20]. Click any linked figure to open the filing page with the row highlighted.
Headcount by Function (year-end)
| Headcount by Function (year-end) | FY2021 | FY2022 | FY2023 | FY2024 | FY2025 |
|---|---|---|---|---|---|
| Product development | 3,015 | 2,582 | 2,284 | 2,125 | 2,173 |
| Sales, customer service and marketing | 1,703 | 1,557 | 1,483 | 1,389 | 1,847 |
| Operations | 1,288 | 1,646 | 1,336 | 1,300 | 1,392 |
| General administration and human resources | 141 | 150 | 165 | 168 | 239 |
| Total employees | 6,147 | 5,935 | 5,268 | 4,982 | 5,651 |
Source: company filings [21] [22] [23] [24]. Click any linked figure to open the filing page with the row highlighted.
China Cash Position and Shareholder Returns
| China Cash Position and Shareholder Returns | FY2021 | FY2022 | FY2023 | FY2024 | FY2025 |
|---|---|---|---|---|---|
| Cash and short-term investments held with large domestic banks in China | 2,500,000 | 2,500,000 | 2,600,000 | 1,600,000 | 2,200,000 |
| Cash dividend declared per ADS for the fiscal year | — | — | — | 0.82 | 0.61 |
| Aggregate cash dividend declared for the fiscal year | — | — | — | 200,600 | 150,000 |
Source: company filings [25] [11] [26] [27]. Click any linked figure to open the filing page with the row highlighted.
Long-Term Record
| Fiscal year | Total revenues | Income from operations | Net income attributable to Weibo's shareholders | Diluted income per share | Net cash provided by operating activities | Purchases of property and equipment | Total shareholders' equity |
|---|---|---|---|---|---|---|---|
| FY2016 | 655,800 | 140,980 | 108,027 | 0.48 | 236,244 | (13,253) | 757,358 |
| FY2017 | 1,150,054 | 407,554 | 352,590 | 1.56 | 539,151 | (20,454) | 1,194,794 |
| FY2018 | 1,718,518 | 609,264 | 571,823 | 2.52 | 488,007 | (28,350) | 1,748,138 |
| FY2019 | 1,766,914 | 597,584 | 494,675 | 2.18 | 631,653 | (21,746) | 2,281,819 |
| FY2020 | 1,689,931 | 506,798 | 313,364 | 1.38 | 741,646 | (34,828) | 2,828,616 |
| FY2021 | 2,257,083 | 697,412 | 428,319 | 1.86 | 814,020 | (35,094) | 3,621,398 |
| FY2022 | 1,836,332 | 480,468 | 85,555 | 0.36 | 564,104 | (43,136) | 3,344,745 |
| FY2023 | 1,759,836 | 472,934 | 342,598 | 1.43 | 672,820 | (36,772) | 3,448,888 |
| FY2024 | 1,754,677 | 494,324 | 300,801 | 1.16 | 639,898 | (61,469) | 3,533,783 |
| FY2025 | 1,757,216 | 464,825 | 449,020 | 1.70 | 519,479 | (42,368) | 3,974,735 |
Source: consolidated statements across filings; older years from the standardized feed [8] [1] [4] [5]. Click any linked figure to open the filing page with the row highlighted.
Operating KPIs
| KPI | FY2021 | FY2022 | FY2023 | FY2024 | FY2025 |
|---|---|---|---|---|---|
| Monthly active users (MAUs), December | 573,000,000 | 586,000,000 | 598,000,000 | 590,000,000 | 567,000,000 |
| Average daily active users (DAUs), December | 249,000,000 | 252,000,000 | 257,000,000 | 260,000,000 | 252,000,000 |
Source: company-reported operating metrics [28] [29] [30] [31]. Click any linked figure to open the filing page with the row highlighted.
Analyst Consensus
Mean target
Median target
High target
Low target
Street ratings: 6 strong buy, 2 buy, 7 hold, 1 sell, 1 strong sell. Consensus: Buy.
Estimate source: S&P Capital IQ (CapIQ) consensus, as of 2026-08-10. Estimate figures are S&P Capital IQ consensus (vendor data — no filing page links). EPS and net income use the normalized (adjusted) consensus where the street reports it. Line-item analyst models (segments, drivers, KPIs) are in the Visible Alpha tab.
Traceability
567 of 589 figures on this page (96%) link to the filing page where they are printed — click a linked figure to open the source PDF at that page with the row highlighted. Unlinked figures come from standardized data feeds or pre-filing years.
Weibo reports in U.S. dollars; all figures are as printed in the filings, in thousands of U.S. dollars (per-share amounts in dollars, share counts in thousands).
FY2023-FY2025 income-statement and cash-flow figures are the three comparative columns of the FY2025 Form 20-F; FY2022 comes from the FY2022 Form 20-F and FY2021 from the FY2021 Form 20-F. Balance-sheet columns are taken from each year's own Form 20-F.
FY2019 and FY2020 long-term figures are comparative columns of the FY2021 Form 20-F; FY2016-FY2018 come from the standardized data feed (SEC XBRL) and are shown without page links, as is FY2019 shareholders' equity (the FY2021 Form 20-F balance sheet presents only 2020 and 2021).
The income statement omits one line the filings print only in FY2022 - 'Impairment of intangible assets' of US$10,176 thousand - so for FY2022 the four expense captions shown sum to US$1,345,688 thousand against printed total costs and expenses of US$1,355,864 thousand. No sum check is attached to that row for this reason.
Total long-term liabilities is shown instead of individual debt lines because the debt captions change year to year: at December 31, 2021 US$896,541 thousand of convertible debt sat in current liabilities, and at December 31, 2023 US$799,325 thousand of unsecured senior notes did. The data feed's 'long_term_debt' field excludes those current-portion amounts.
The advertising and marketing subtotal is printed on an unlabelled row in the Form 20-F statements, so its citation quote is the numeric row itself.
Weibo paid no dividend before 2023; the dividend line does not appear in the FY2021 or FY2022 cash-flow statements.
Quarterly figures come from the quarterly results announcements (Form 6-K / HKEX). Those announcements print a three-month statement of operations and a period-end balance sheet but no cash-flow statement, so no quarterly cash flow is shown. Balance-sheet captions there are more condensed than the Form 20-F (for example accounts receivable is presented net of all counterparties, and lease liabilities are folded into accrued expenses and other current liabilities).
Q4 FY25 shows a net loss attributable to Weibo's shareholders of US$4,722 thousand despite positive net income, driven by US$1,335 thousand of income attributable to non-controlling interests and US$6,119 thousand of accretion to redeemable non-controlling interests; diluted shares equal basic shares in that quarter because of the loss.
Every value in the FY2021-FY2025 columns and every quarterly value was read off the cited filing page. Cross-checking against data/financials/*.json found no differences beyond rounding, so no discrepancies are recorded.
Weibo Corporation's management explains the business in its own materials. The slides below do the most of that work, pulled from the documents preserved in Sources. Each source link opens the complete presentation at that slide in a new tab.
Environmental, Social and Governance Report 2025 — FY2025
Weibo publishes no investor deck; this annual ESG report is the only slide-format document management produces, and its opening and platform sections are the clearest self-description of the user base, the content verticals, the ad machine and the AI products. · Open the full document →
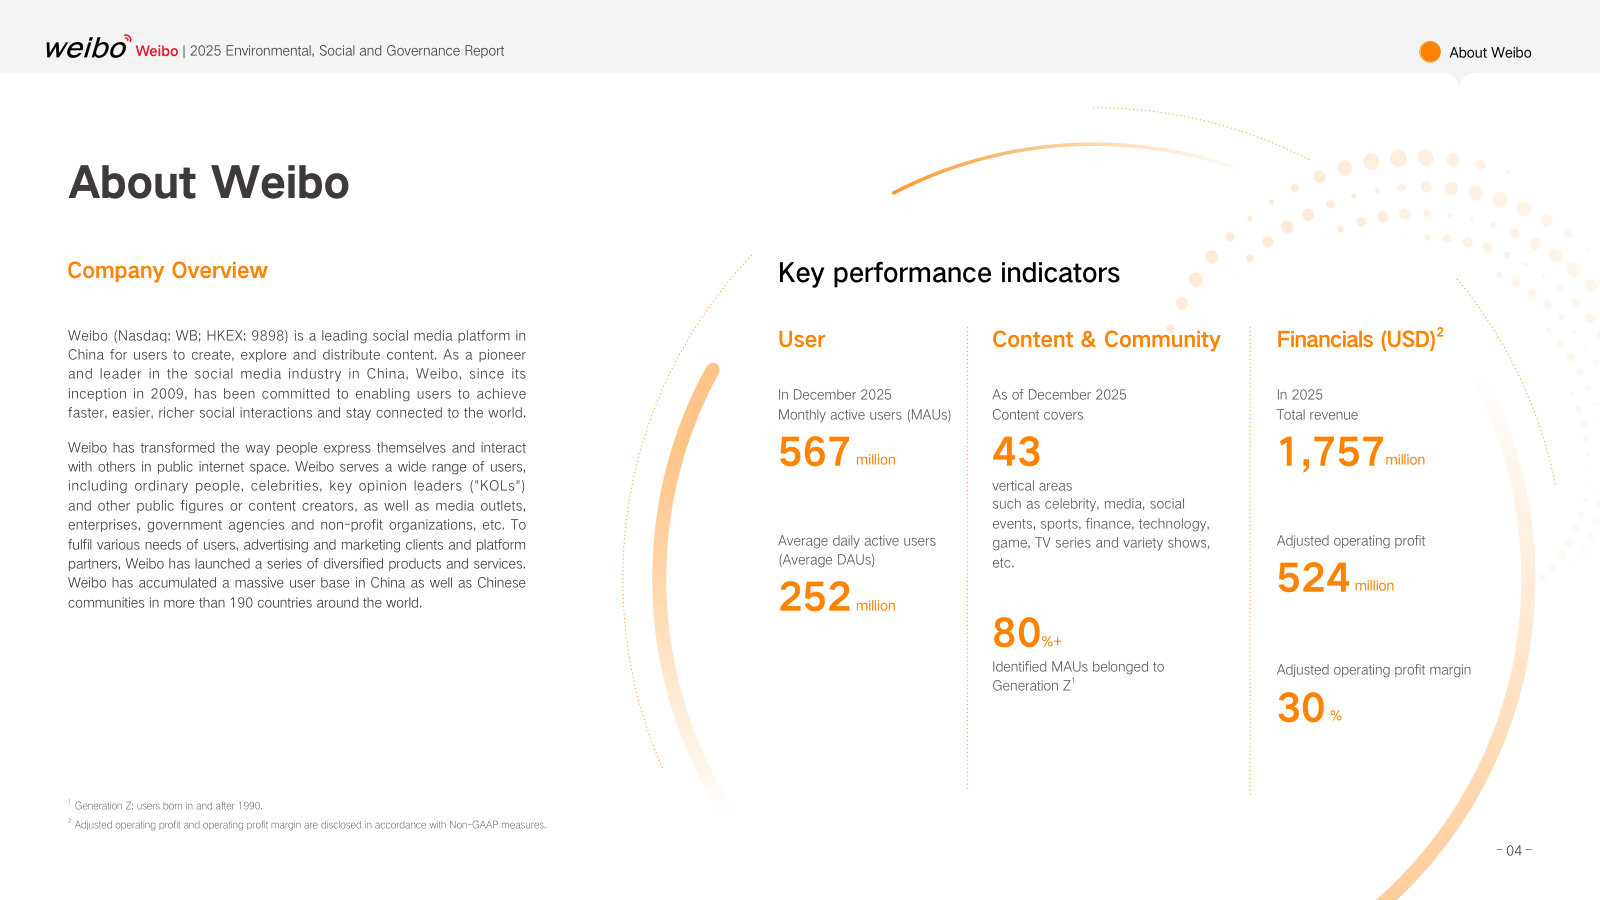
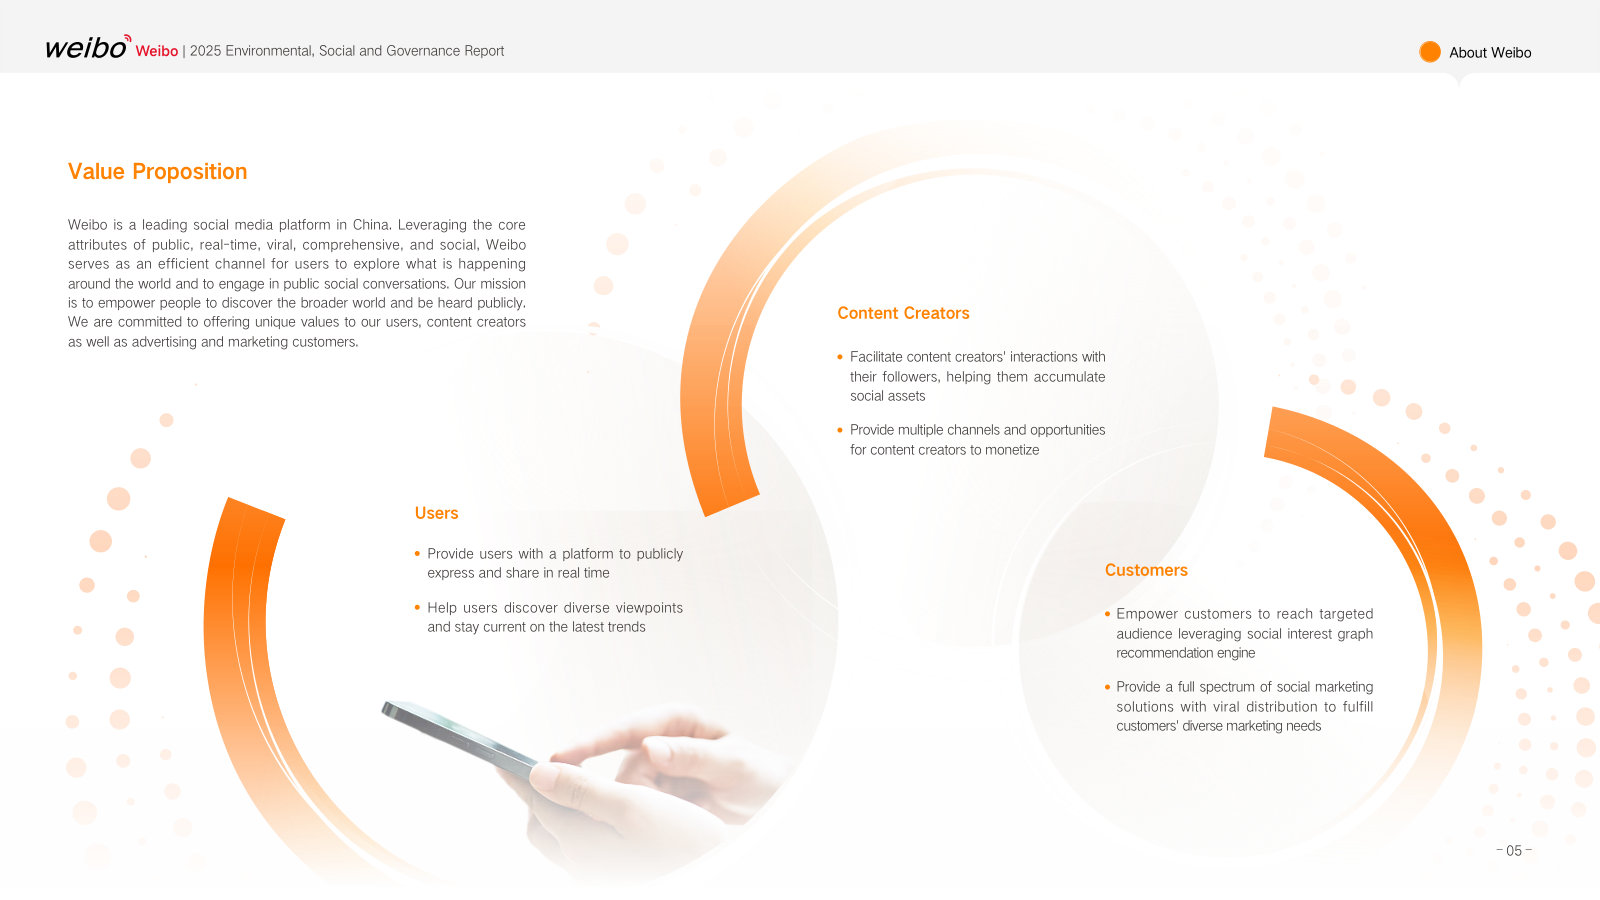
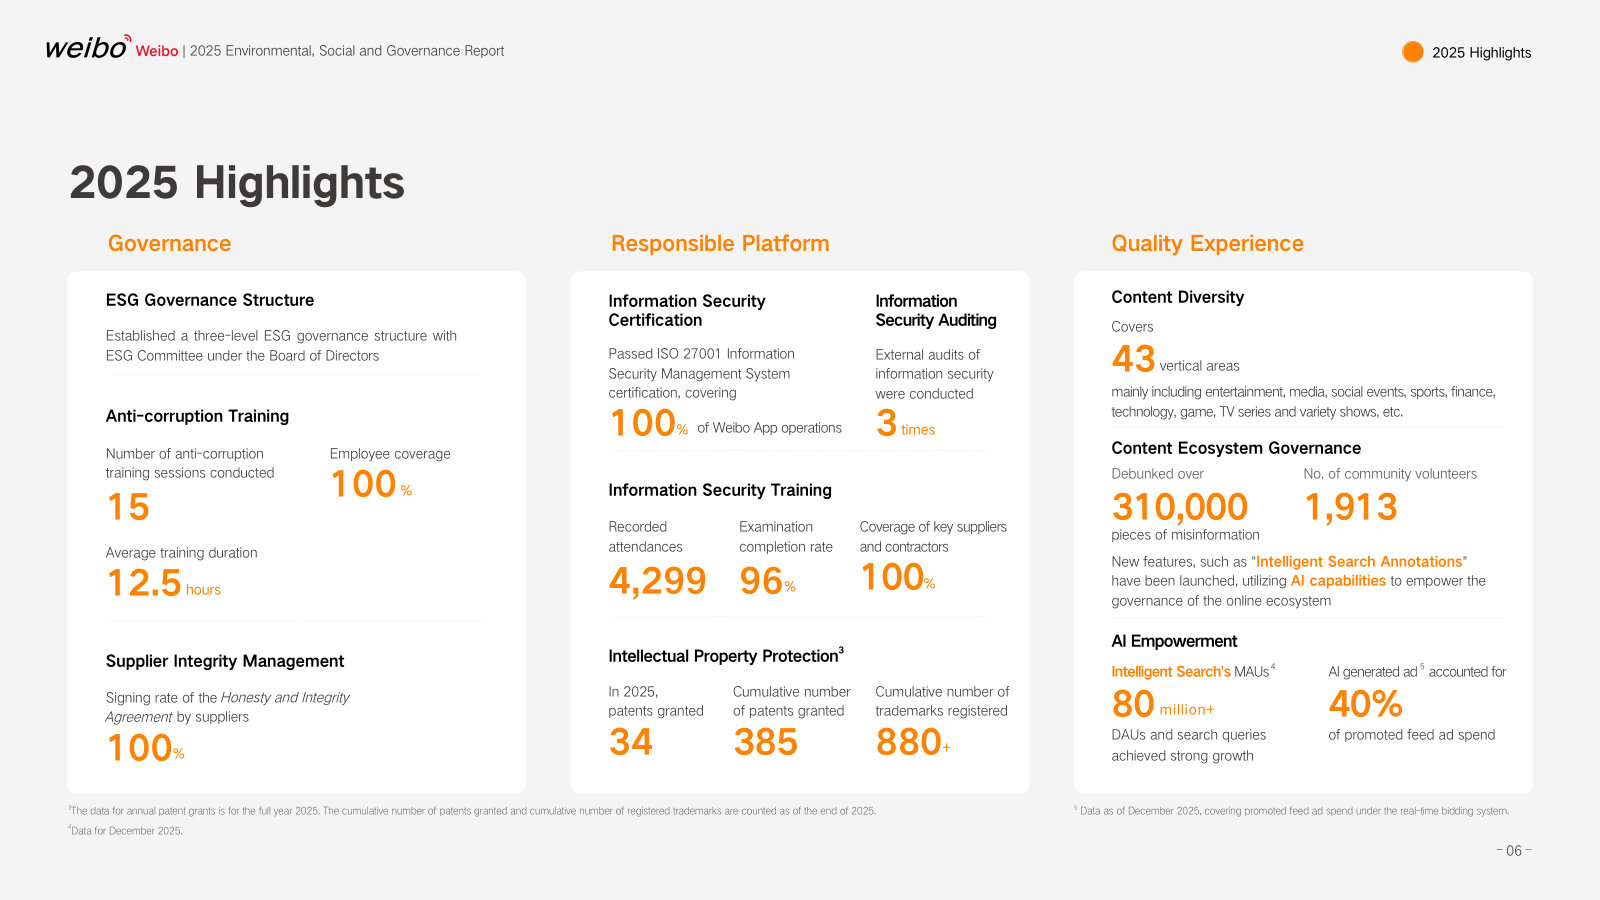
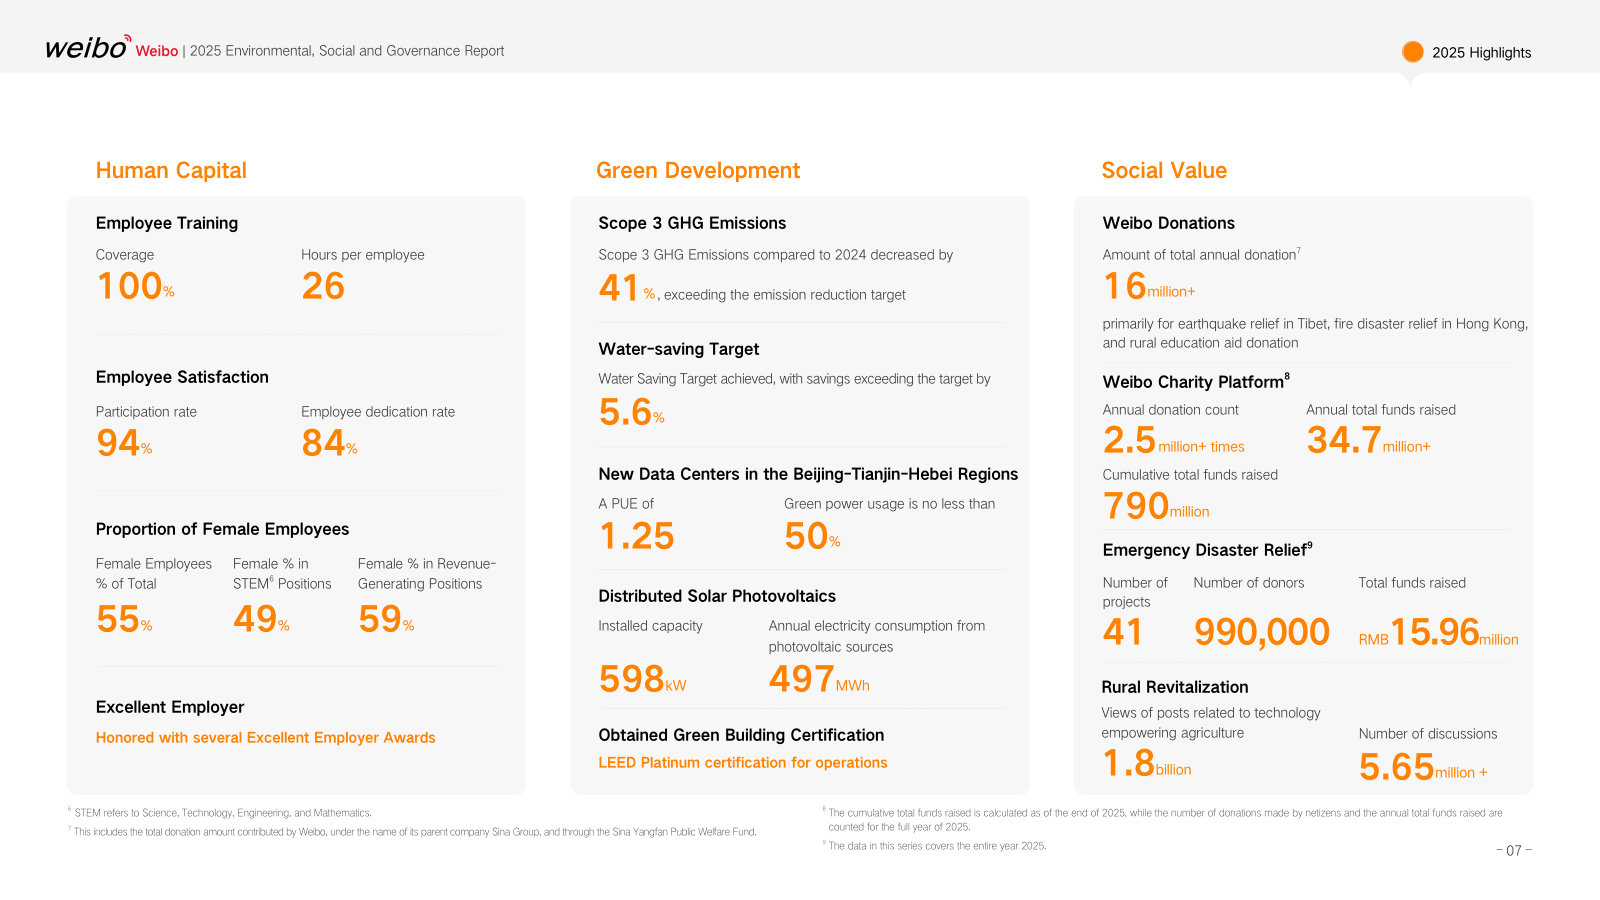
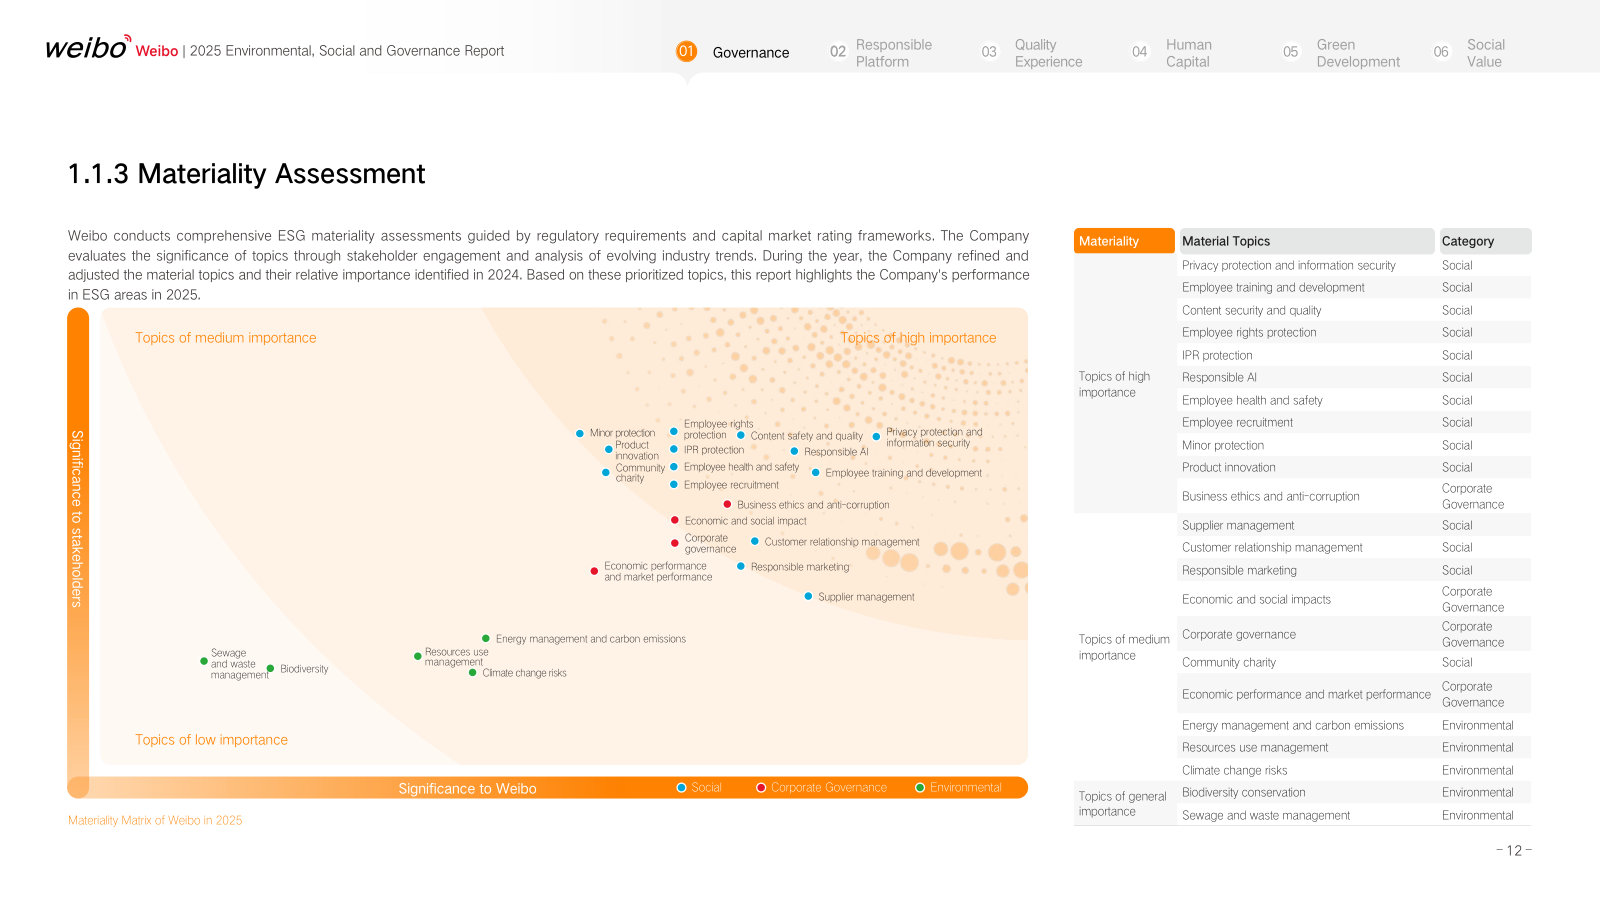
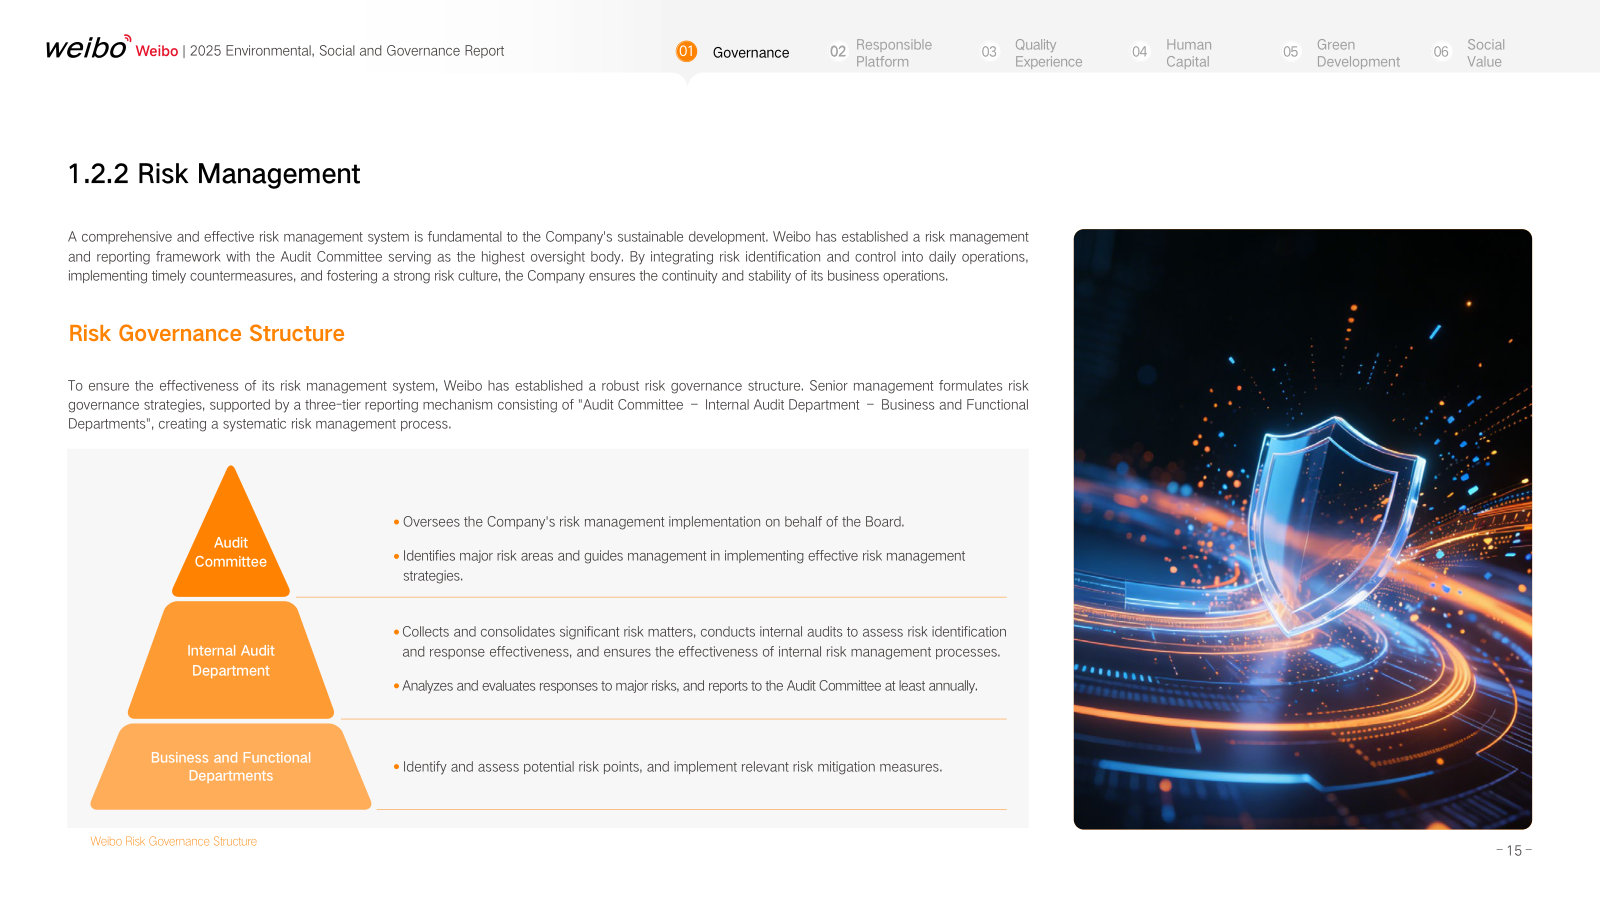
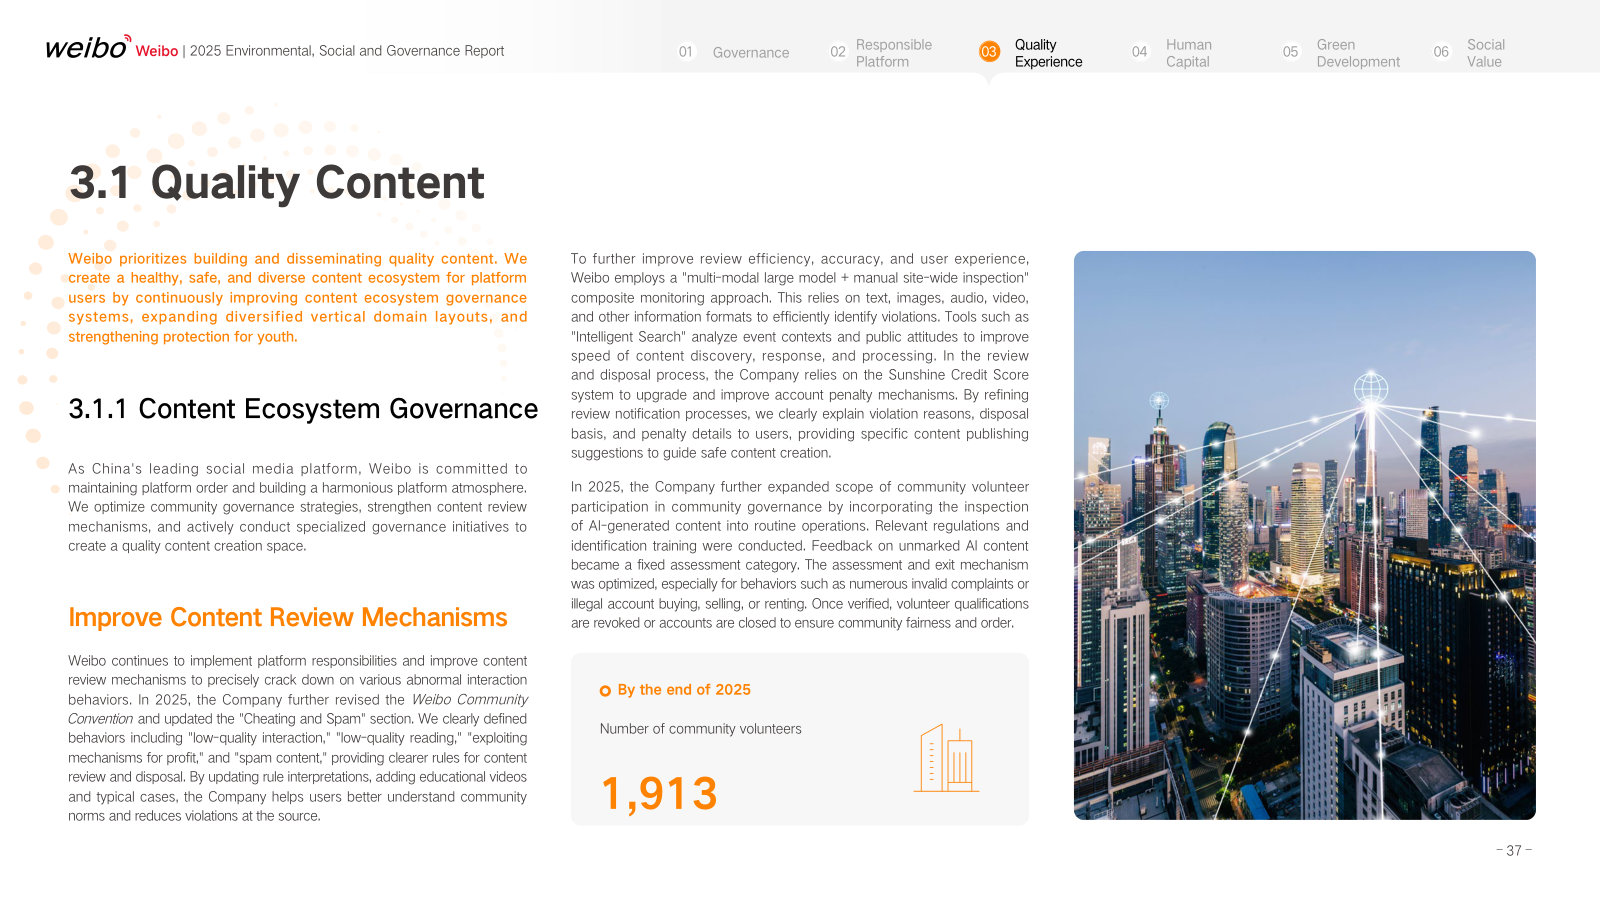
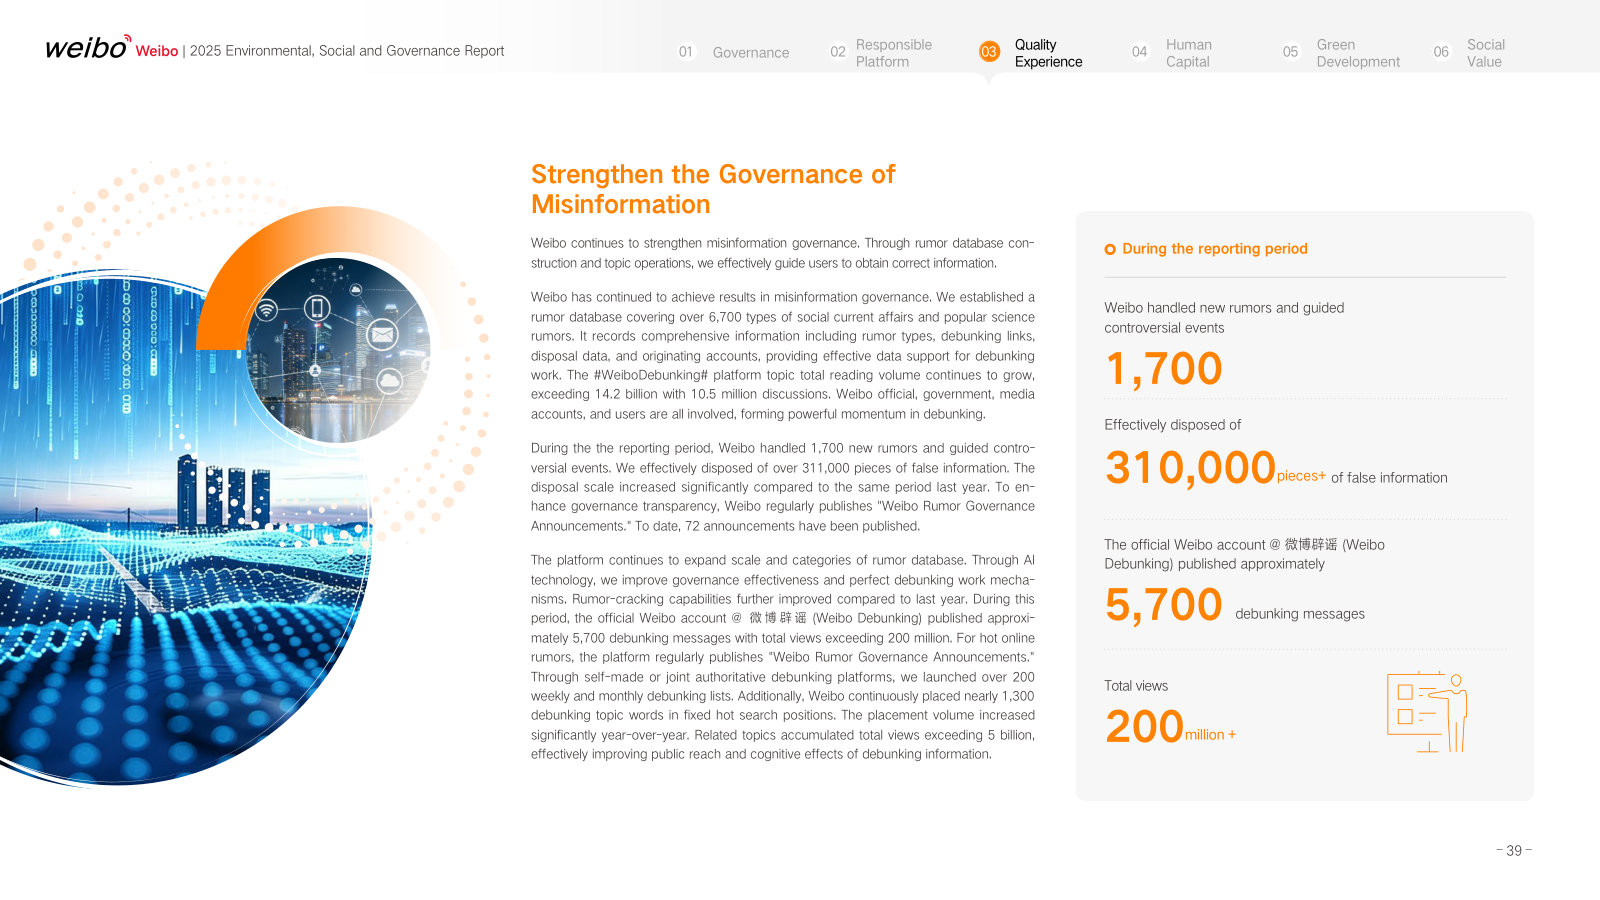
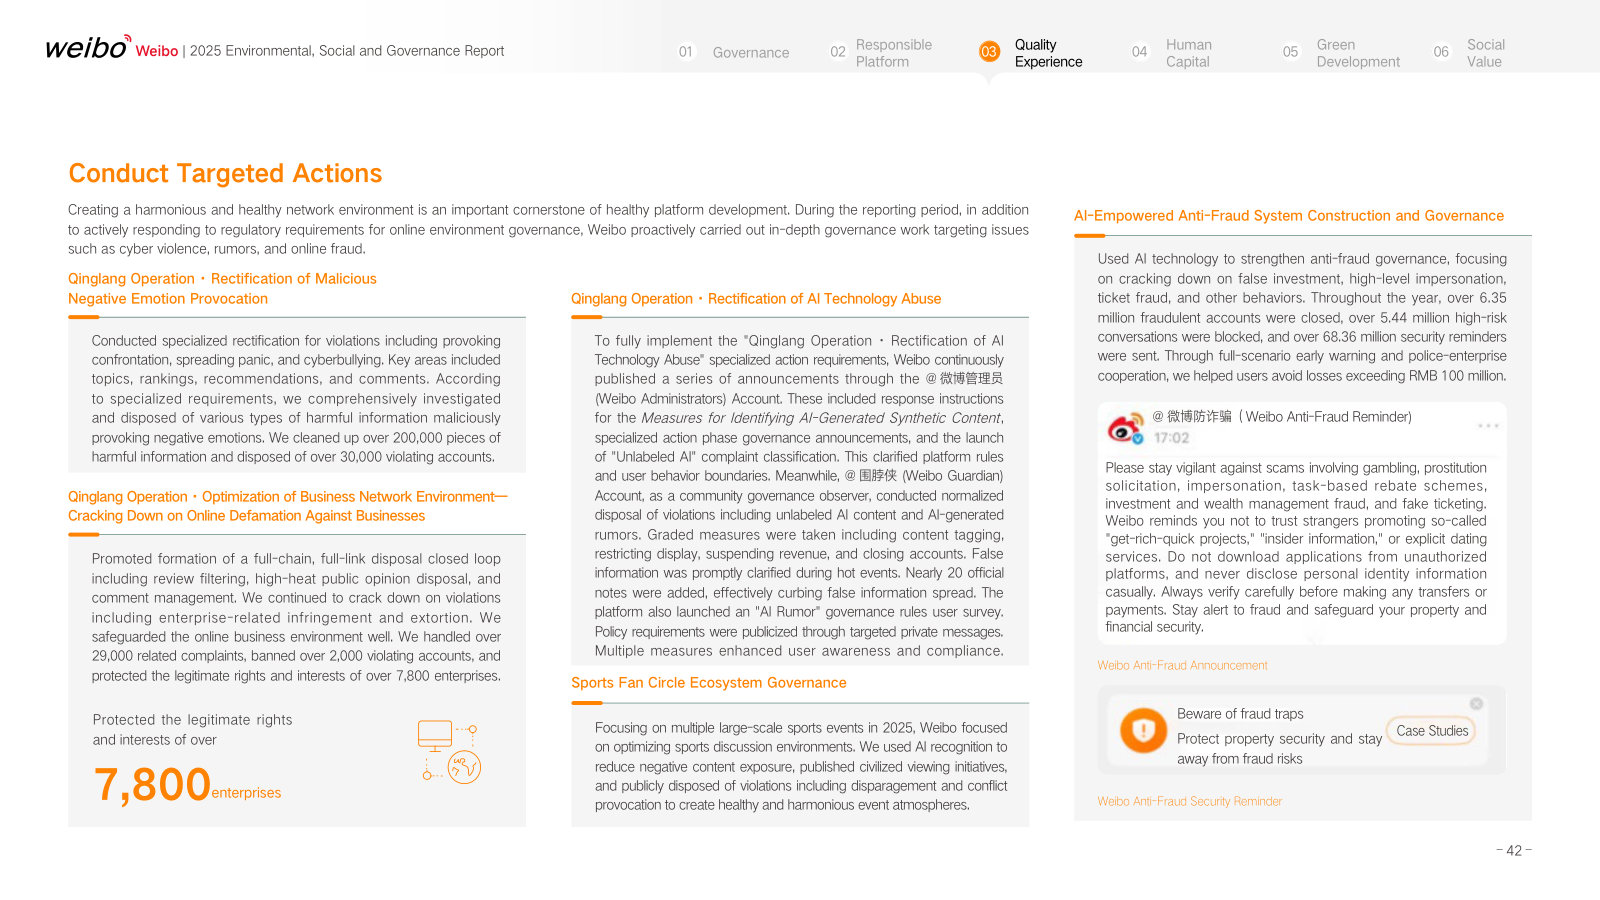
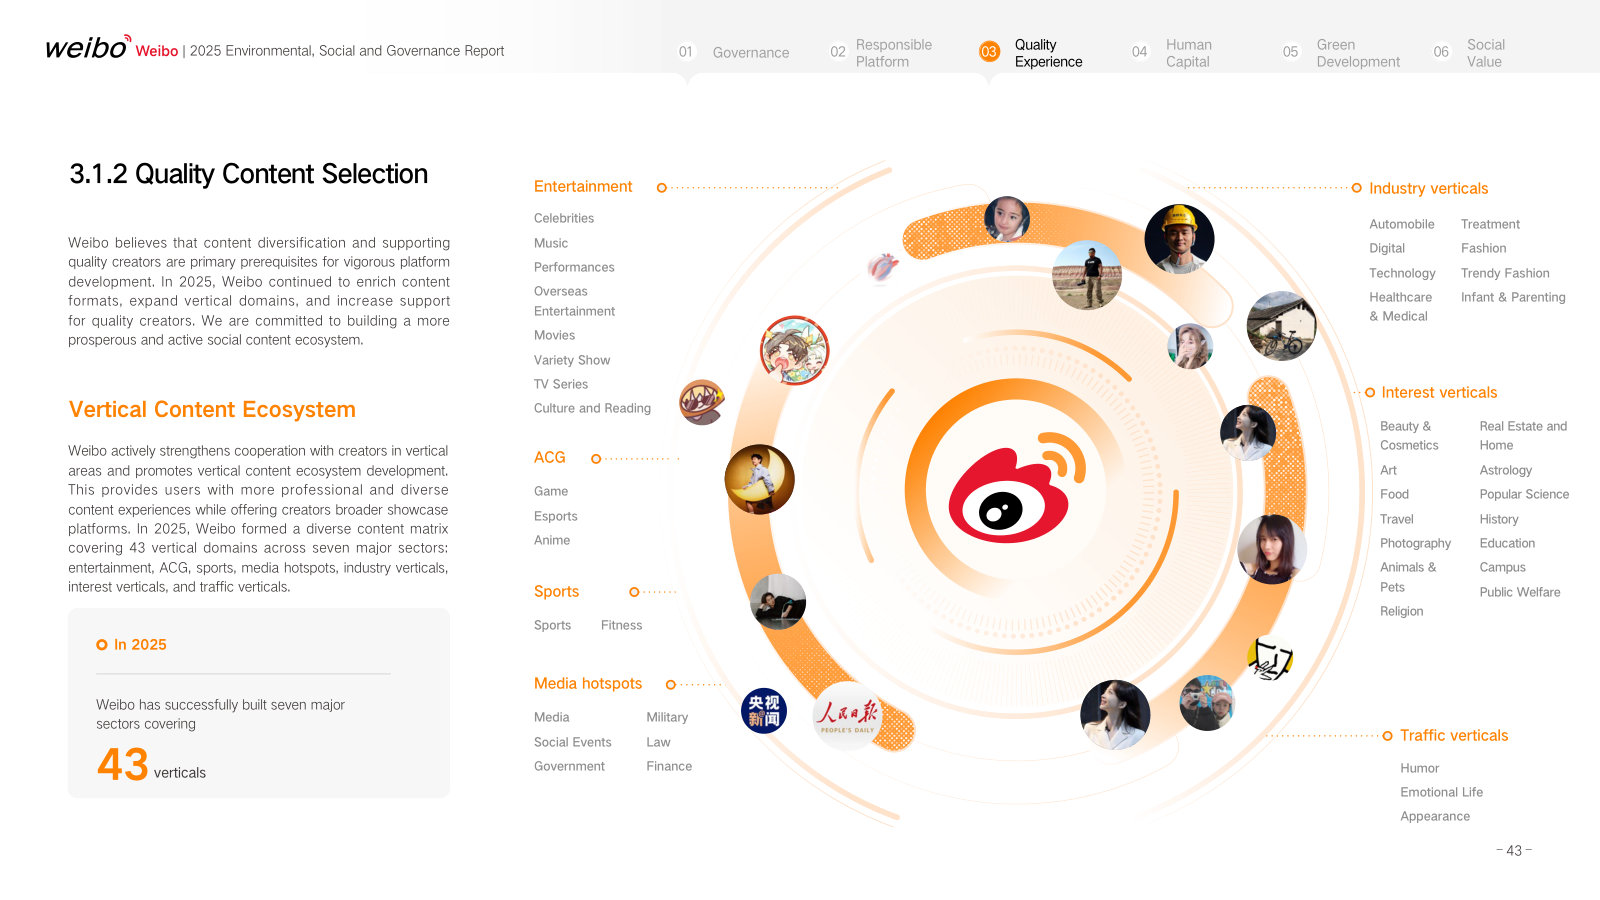
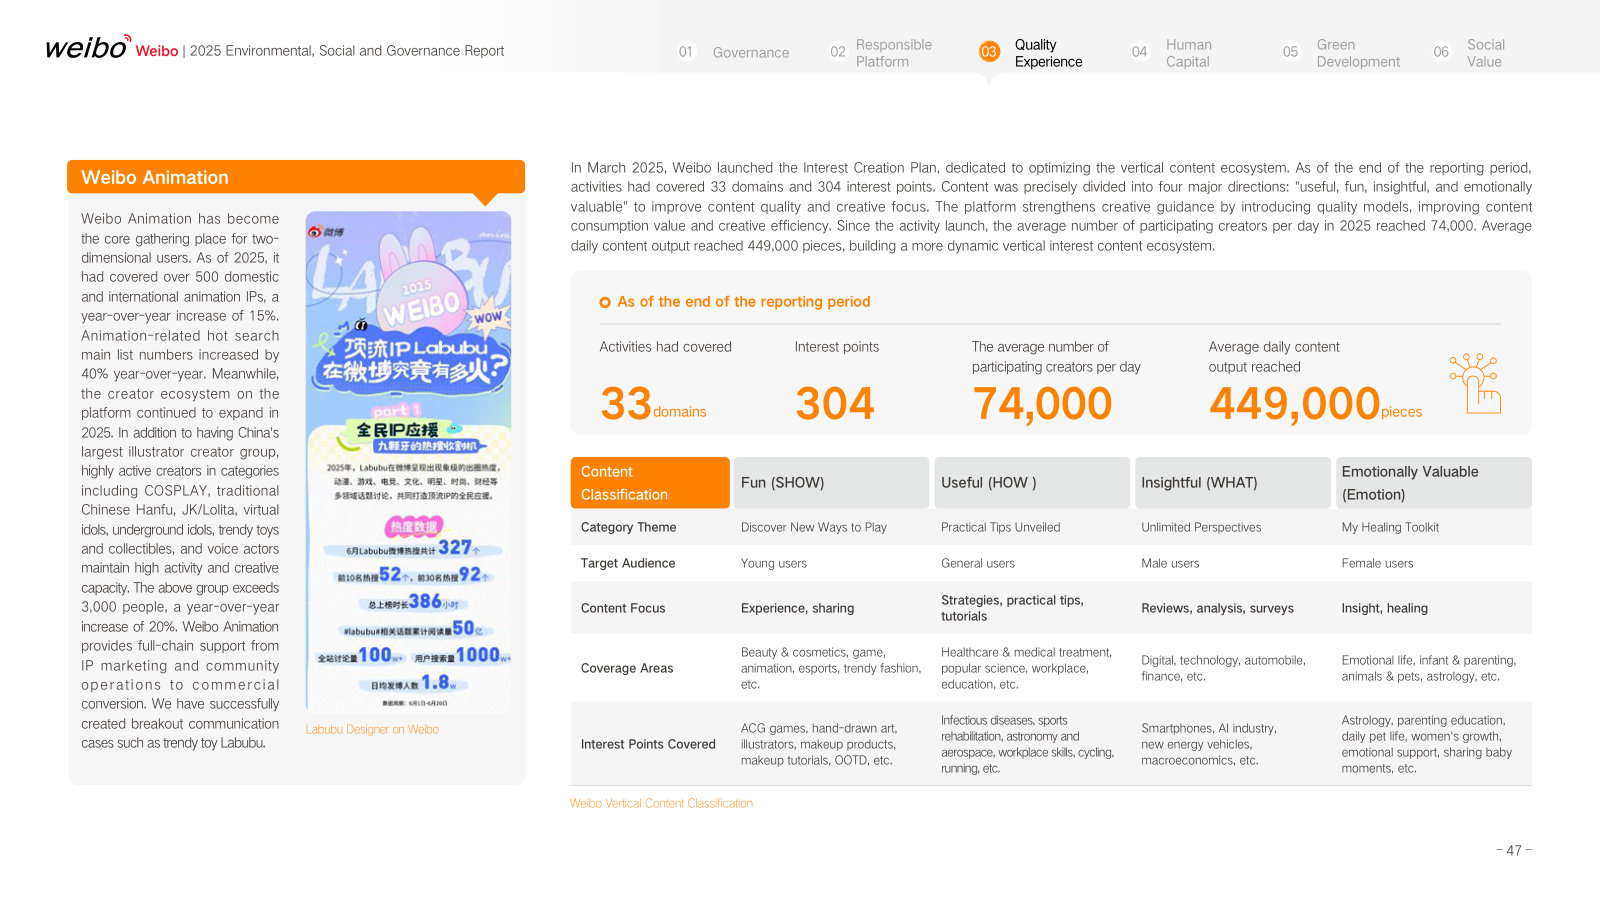
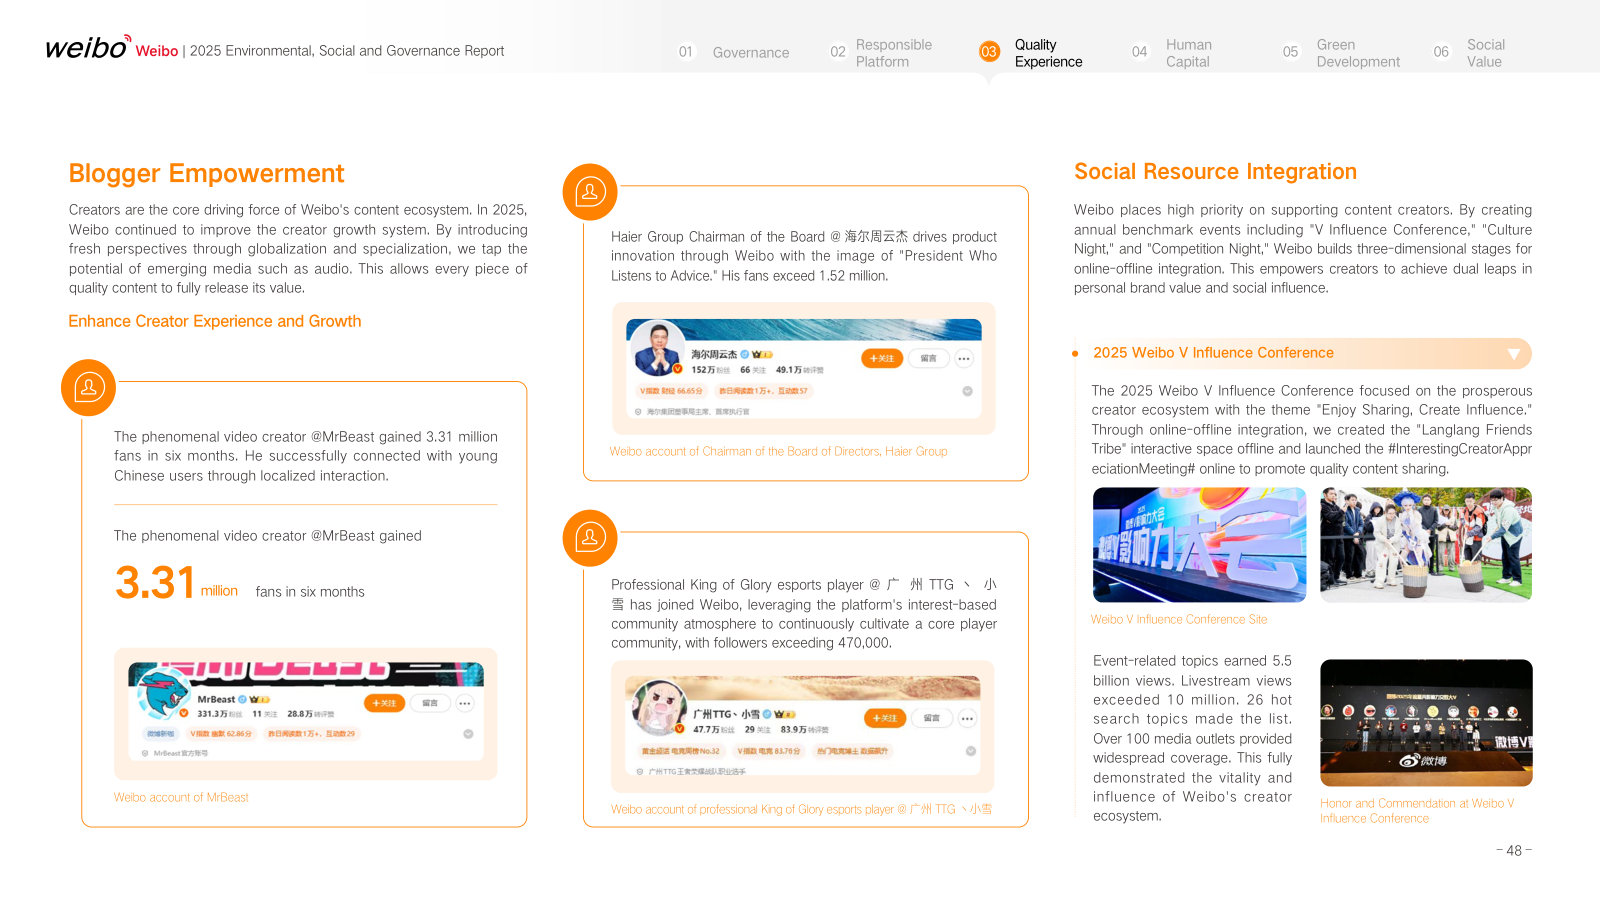
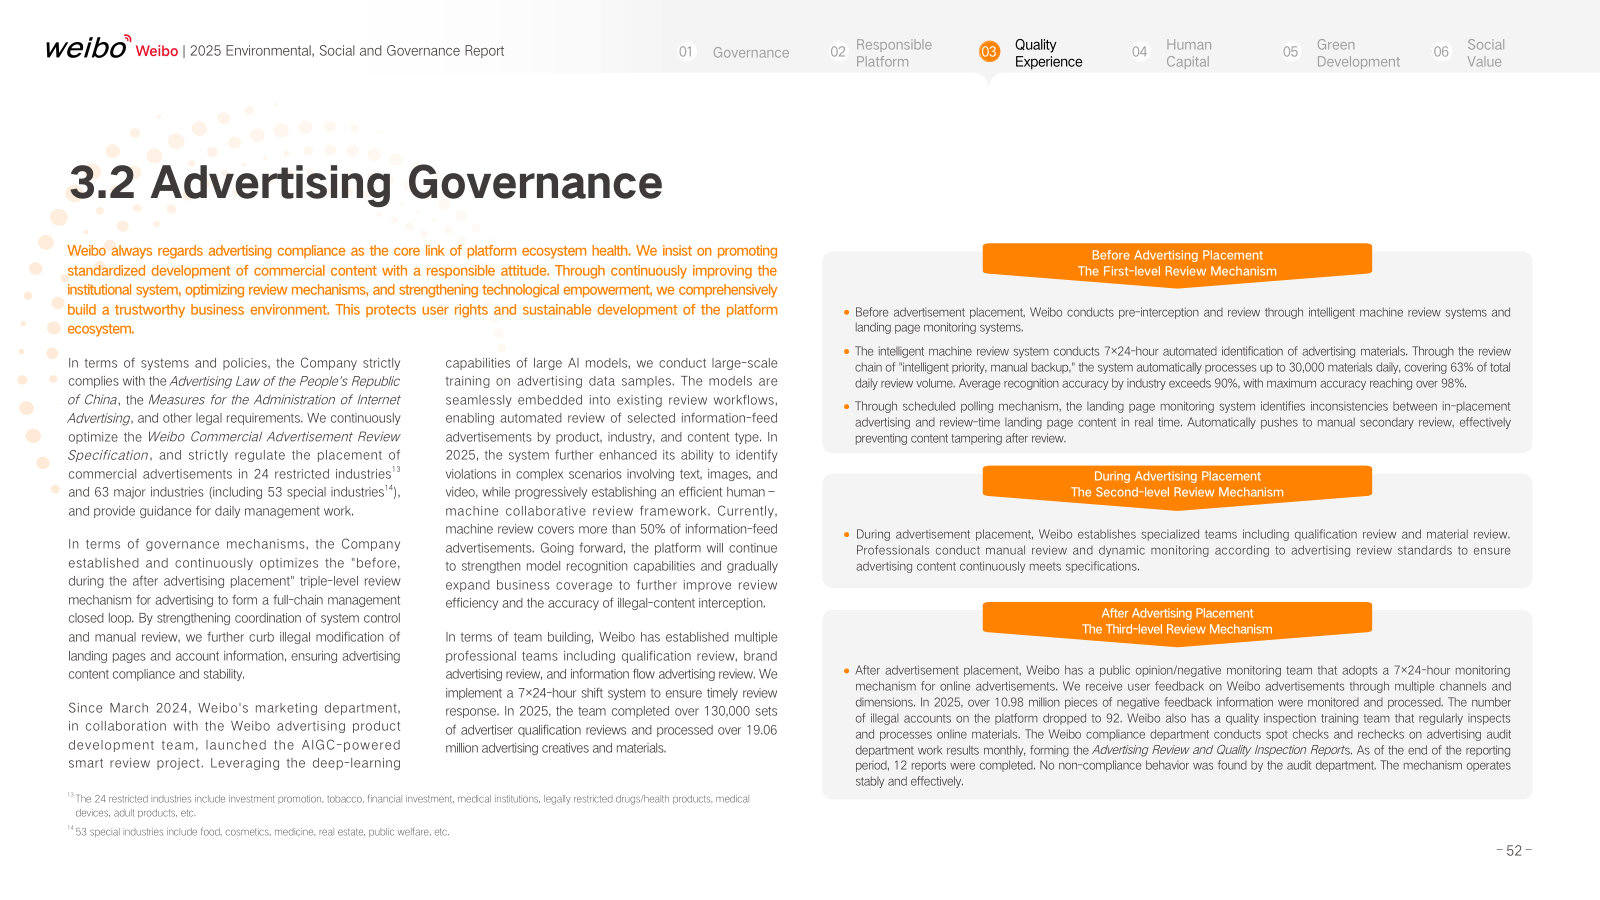
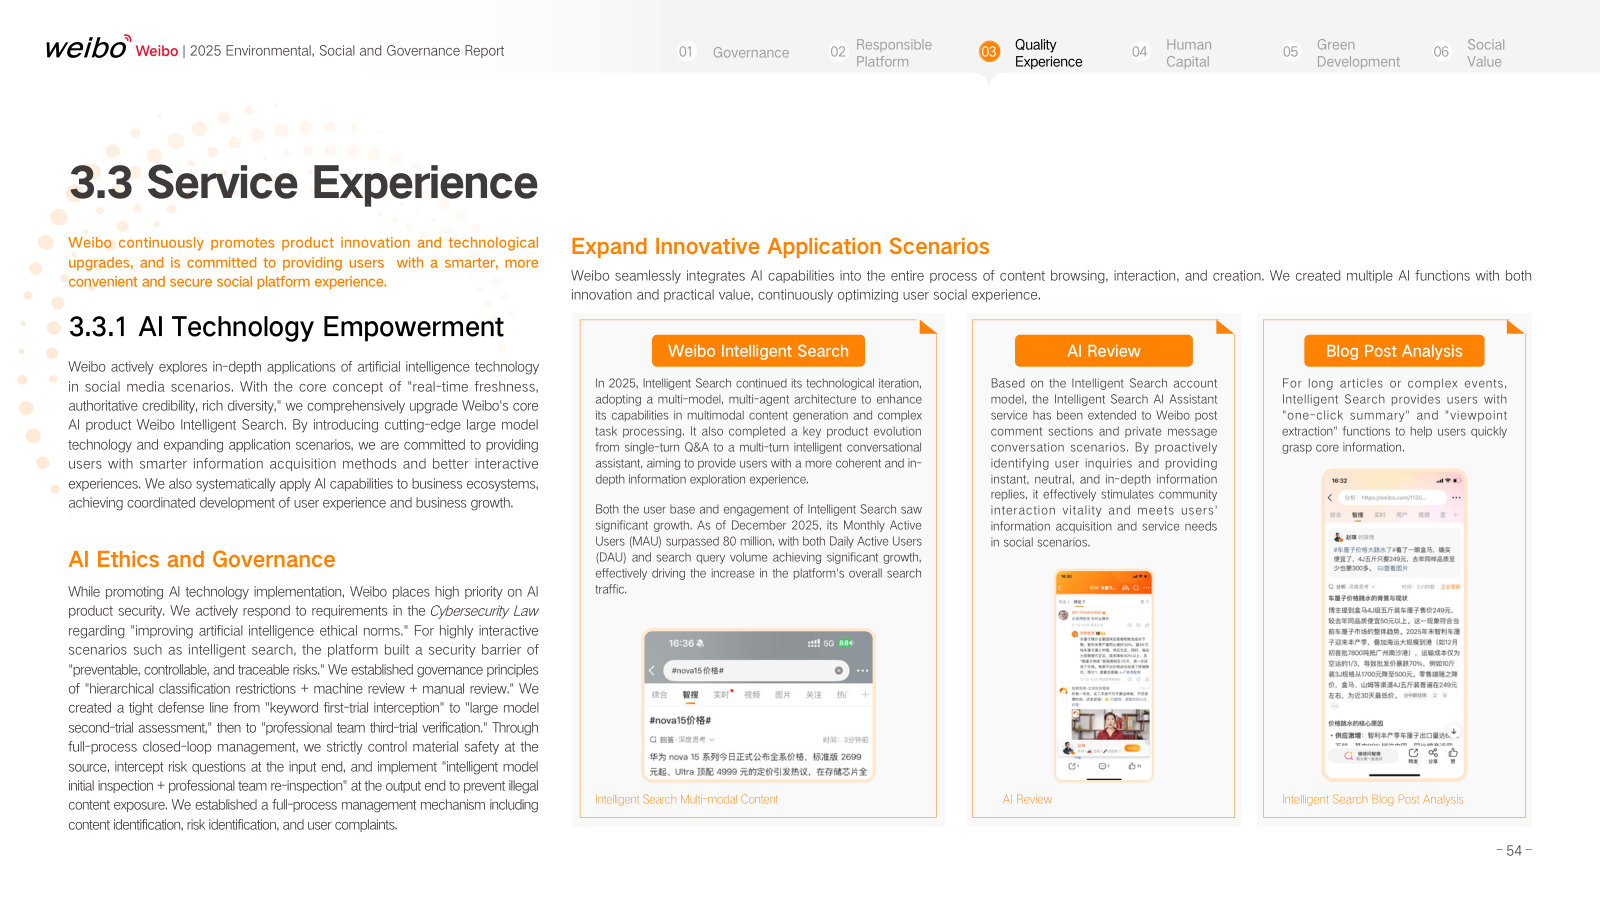
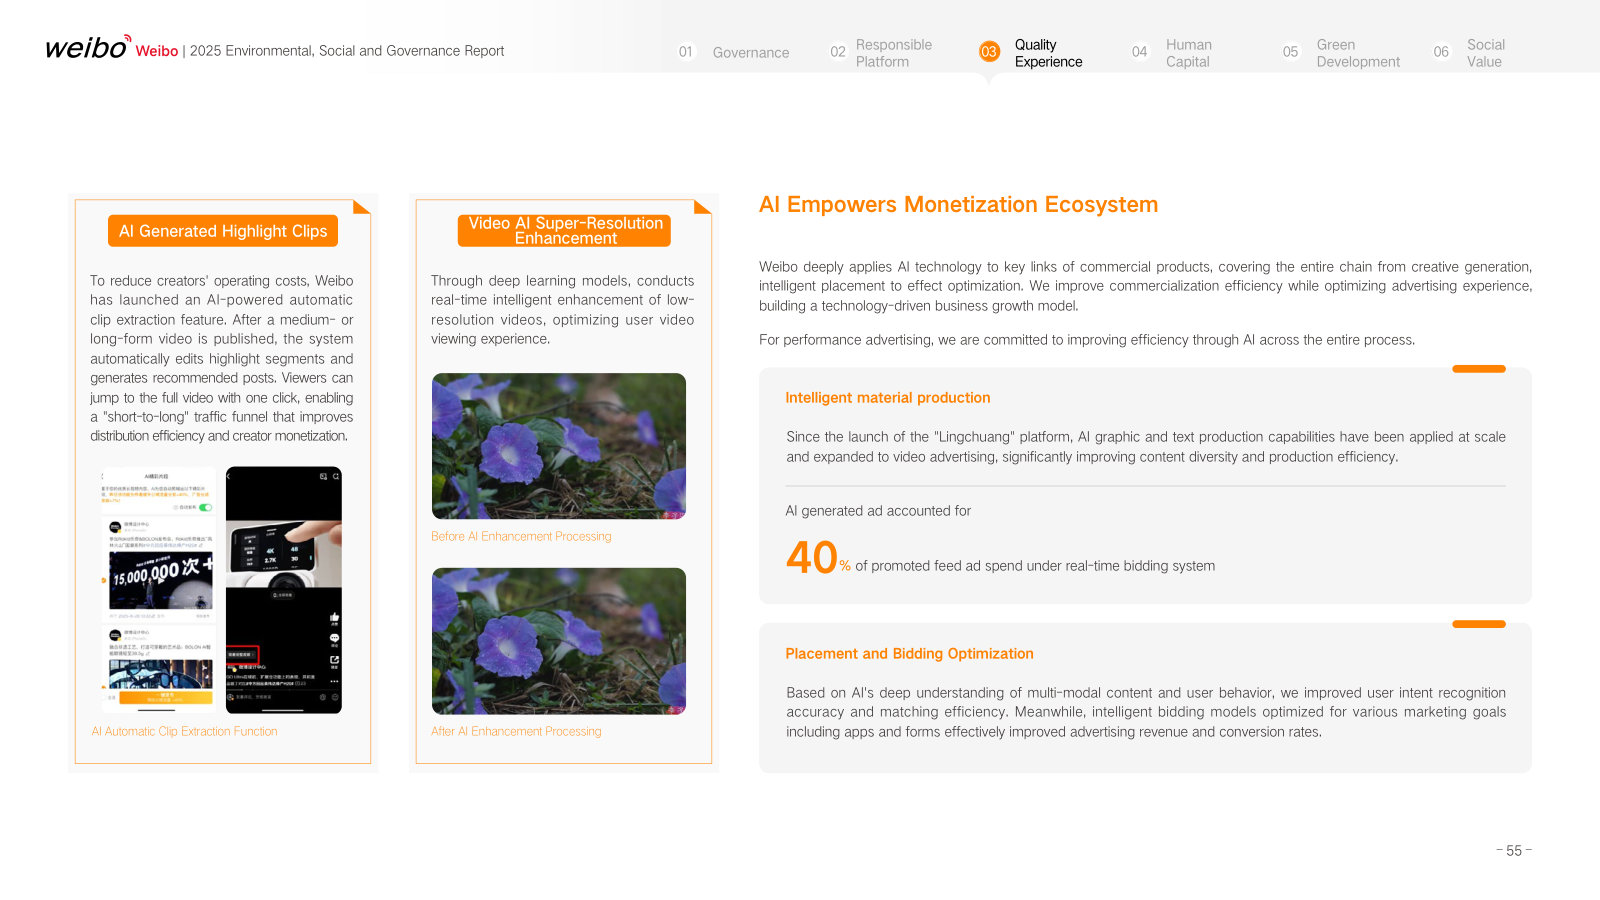
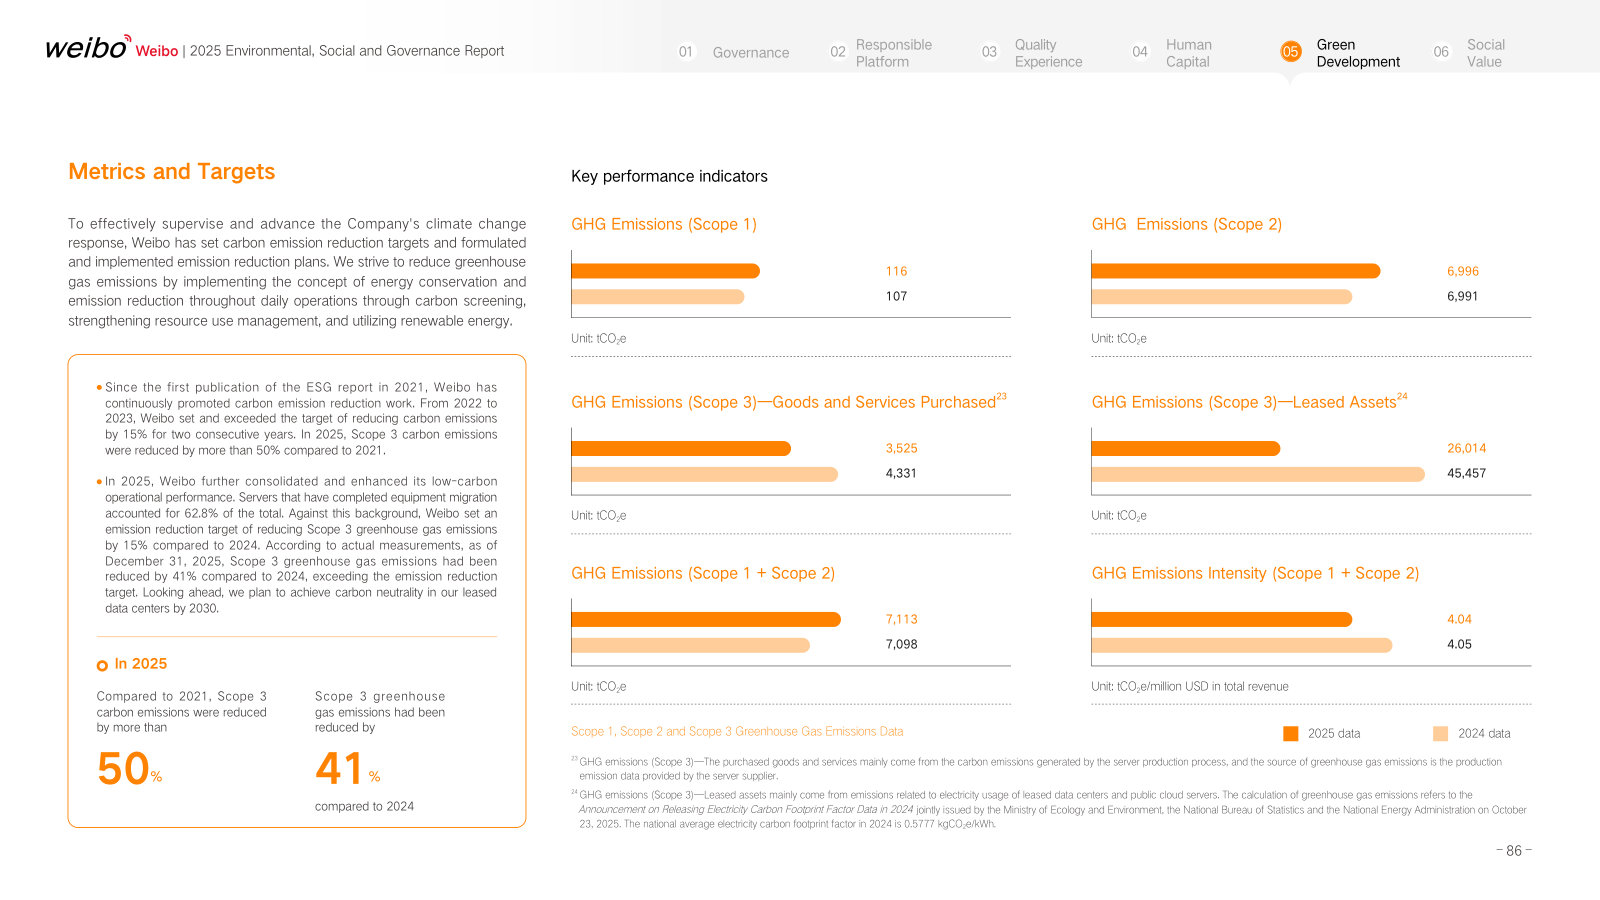
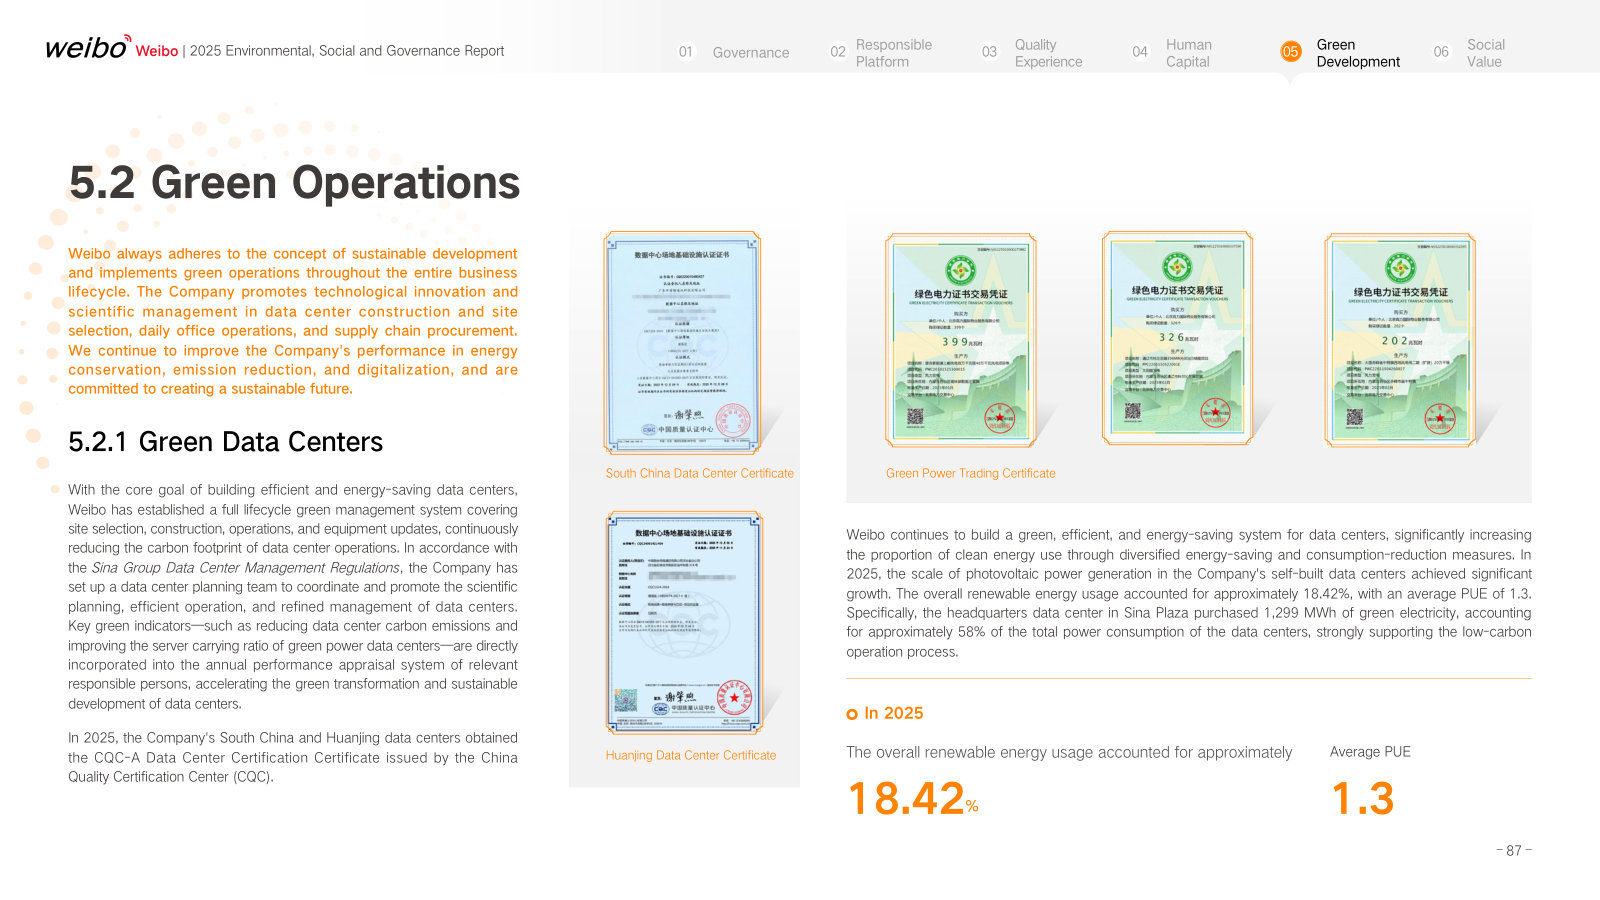
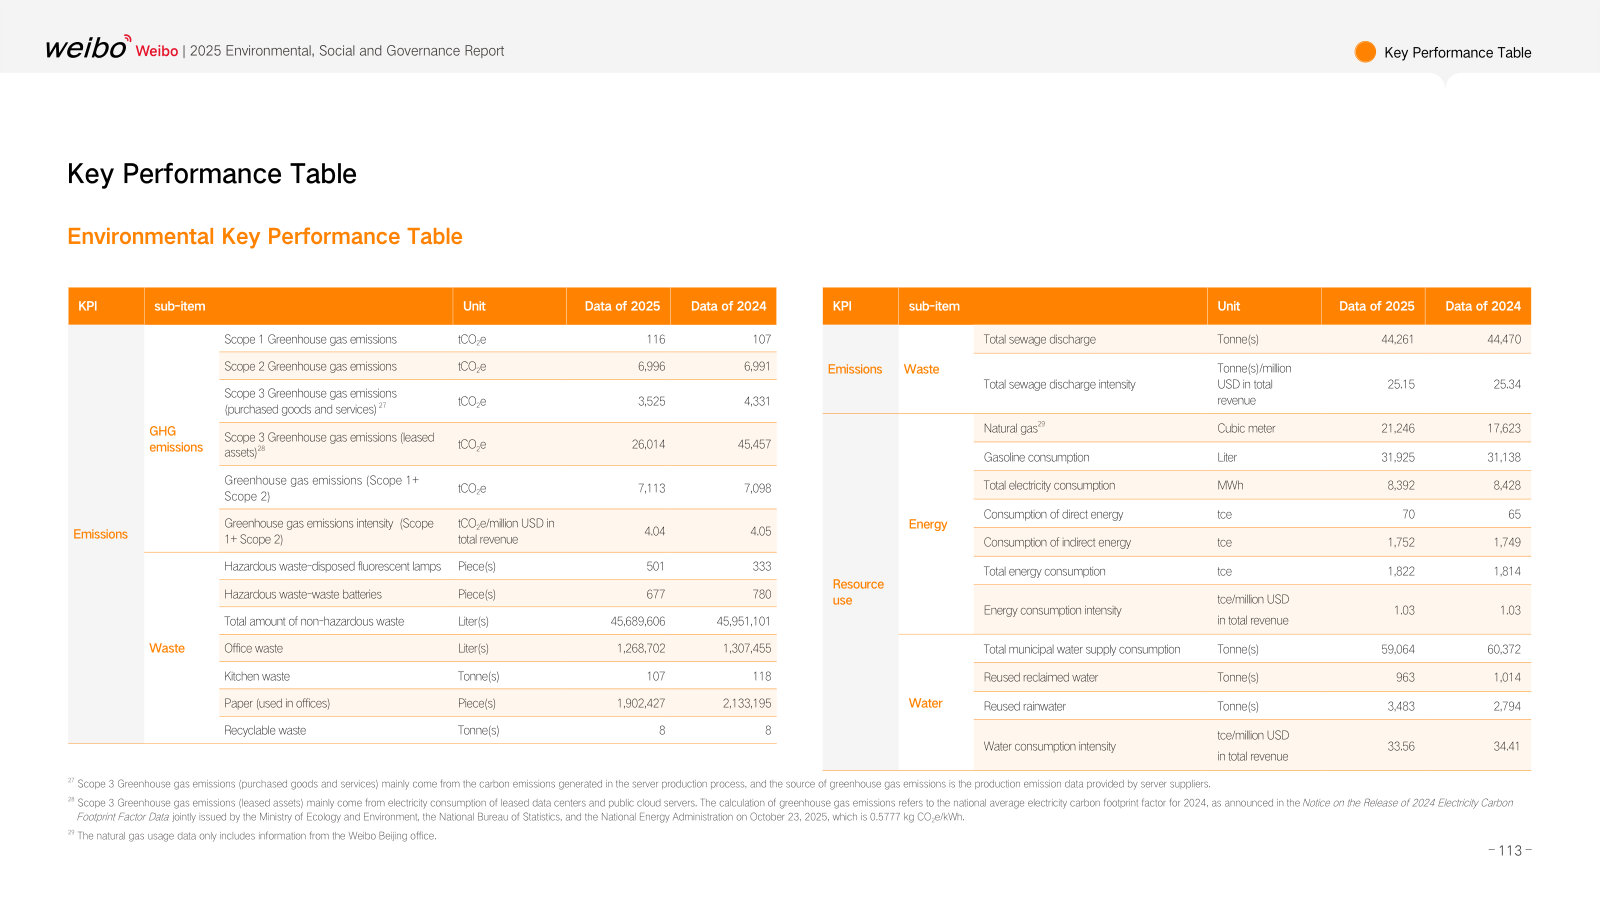
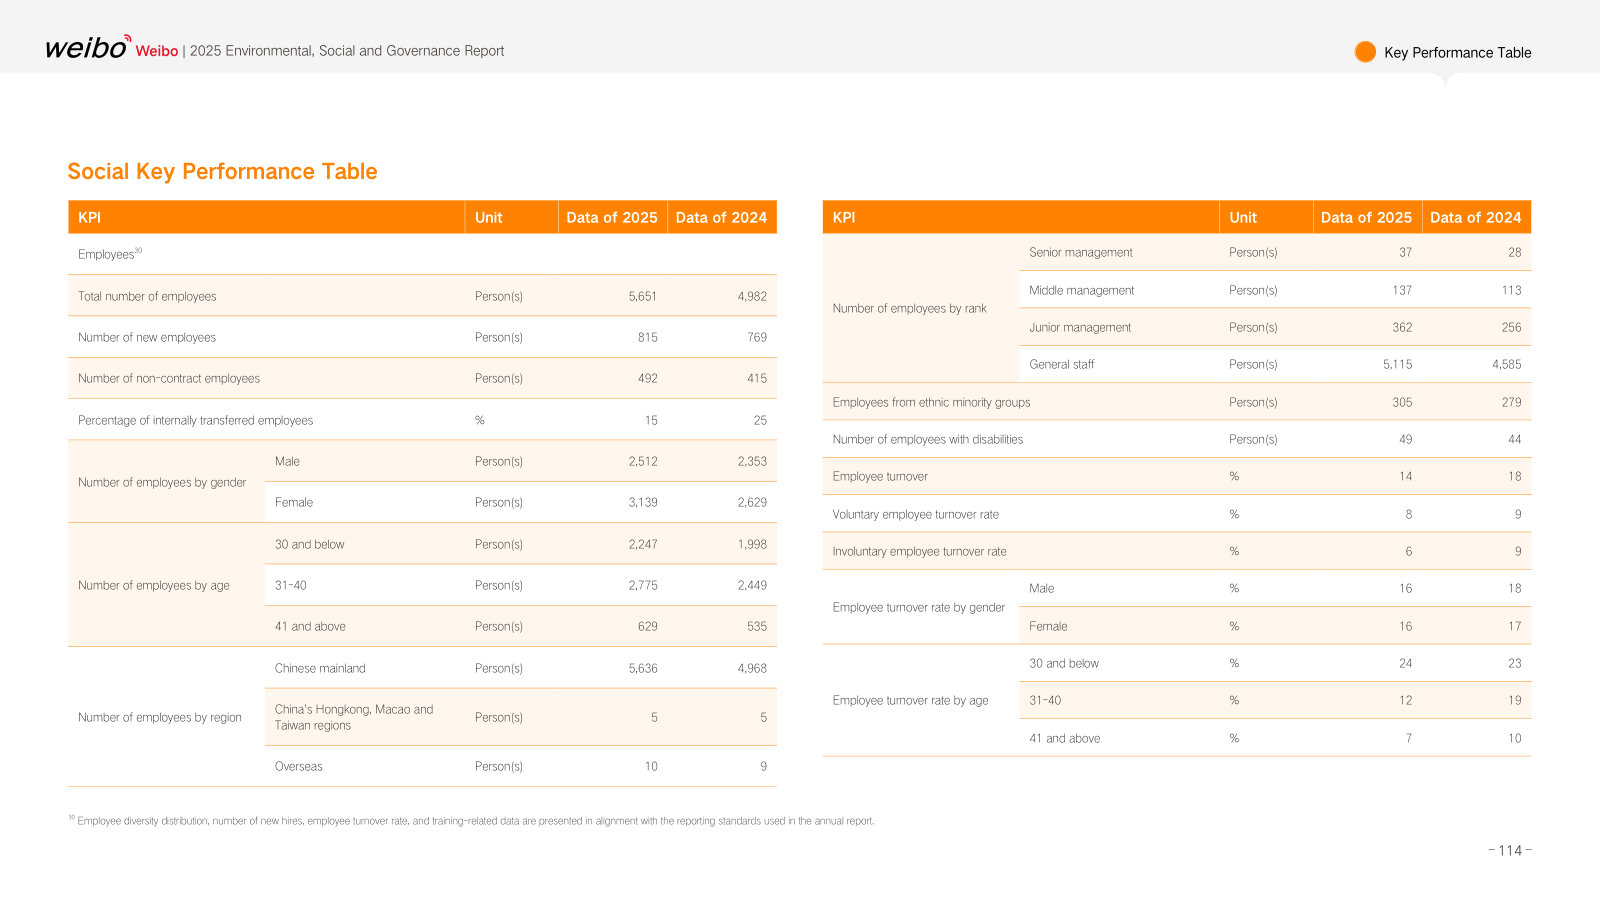
More from management
Environmental, Social and Governance Report 2024 — FY2024 · 110 pages · Same structure a year earlier: the FY2024 user, revenue and emissions baseline against which the 2025 report is written. · Open →
Environmental, Social and Governance Report 2023 — FY2023 · 114 pages · The FY2023 edition, with a misinformation-governance timeline and vertical-by-vertical detail the later reports dropped. · Open →
Weibo Corporation's management answers for the business every quarter. These are the exchanges that explain it best — verbatim, from the call transcripts preserved in Sources. Each link opens the full transcript at that page in a new tab.
Q1 2026 Earnings Call — Q1 2026
The most recent call: why users are still shrinking on purpose, what is actually driving the 9% ad rebound, and why margin fell to 28%. · Open the full transcript →
The 2026 plan in one paragraph: retention over reach, with the feed still mid-repair and video carrying time spent.
Gaofei Wang (Chief Executive Officer, interpreted): Next, I will highlight Weibo's key development in the first quarter across user growth and engagement, content ecosystem competitiveness and monetization. On user growth and engagement, in 2026, we will focus on improving user retention and building a high-quality, highly engaged and sustainable user growth framework. Information feed still remains in optimization stage post the product update last year and related strategies began to deliver positive results starting in March, with content consumption and interactive measures among our core users beginning to improve. And meanwhile, the sustained growth in time spent on our video playback pages has served as a more solid foundation for the growth of our overall user time spent and retention.
p. 6 · Read in context →
The two-part monetization formula — sell content marketing into more verticals, let AI do the conversion work.
Gaofei Wang (Chief Executive Officer, interpreted): We have continued to execute on 2 key strategies that have underpinned our ad products and sales teams since 2025. First, driving broader adoption of Weibo's unique content marketing value across more industries and clients. And second, systematically improving ad conversion effectiveness by leveraging AI capabilities. In the first quarter, Weibo's ad revenues increased 9% year-over-year. Overall, we will continue to leverage differentiated strength in hot trends plus social plus content marketing across proven marketing scenarios such as new product launches, Chinese New Year campaign, sports events and celebrity marketing, leading to growth across multiple key industries. By industry, the main growth contributors in the first quarter were verticals such as Internet services, Local services and Automobiles.
p. 10 · Read in context →
MAU falls while DAU holds: management ties the gap to its own channel-spend cuts, not to disengagement.
Cao Fei (Chief Financial Officer): In March 2026, Weibo's MAUs and average DAUs reached 562 million and 254 million, respectively. During the first quarter, we continued to focus on user quality, retention and engagement. MAUs saw more of this sequential decline, mainly reflecting our ongoing rationalization of channel investment and the transition forming our information feed revamp. At the same time, DAUs remained resilient and improved slightly quarter-over-quarter, supported by better retention of core users, continued optimization of the homepage feed experience and improving video consumption.
p. 12 · Read in context →
Where the five points of margin went: ad production and marketing spend on monetization initiatives, taken deliberately.
Cao Fei (Chief Financial Officer): Total cost and expenses for the first quarter were USD 301.5 million, an increase of 13%, mainly due to higher ad production cost and marketing expense, partially offset by the decrease of general and administrative expense. During the quarter, we continued to make major investments in selected monetization-related initiatives primarily around advertising product capabilities, content marketing ecosystem and client service offerings. We will continue to manage the pace of these investments with ROI discipline and within a controllable budget framework. Operating income in the first quarter was USD 119.8 million, representing operating margin of 28% compared to 33% in the same period last year. […] While operating margin declined year-over-year due to these investments, we remain focused on balancing near-term execution needs with sustainable profitability and healthy cash flow generation.
p. 14 · Read in context →
The distinction that matters: ad revenue grew while the customers buying it are under margin pressure.
Gaofei Wang (Chief Executive Officer, interpreted), answering the first analyst question on the ad outlook: And next, I would like to say that in Q1, overall speaking, we had a better than expectation growth of our ad revenue in terms of the consumption area. But if you're talking about the key accounts that we have, especially from different verticals, we've been seeing a stressful situation. For instance, in terms of automotive sales, they've been experiencing double-digit decrease. And for the handset, they had also a decrease in terms of their overall revenue because of the additional cost of the memory, and most of the handset makers have to adjust their overall price. And also for e-commerce, we've been experiencing also a stressful profitability situation.
So even if our ad revenue was growing, we have still a stressful operation for our customers.
p. 16 · Read in context →
Why AI-generated ad creative is not being pushed to scale — public acceptance is the gating test, not capability.
Gaofei Wang (Chief Executive Officer, interpreted): So AI is pretty much useful in generating those ad materials for those KOLs to be very much facilitative. But of course, in Q1 and Q2, we've been seeing some of the headwinds in terms of the adoption rate as well as the acceptance by the public in terms of those ad generated by AI or those contents generated by AI. So at the current stage, we're not doing a massive commercialization as for the front. But still, we are going to wait still. We are doing some internal testing among the KOLs and the public acceptance is the criteria for us to evaluate the before we go massive commercialization.
p. 18 · Read in context →
The purpose of the feed revamp stated bluntly: break the dependence on the relationship-based feed, accept the transition pain.
Jennifer Huang (UBS); Gaofei Wang (Chief Executive Officer, interpreted): So we had a lower number of pre-installs and also on the user side as well. And in Q1, you can see that we've been seeing a very good user acquisition. We can see a user acquisition cost increase because it was actually the hot season in terms of the AI application adoption and also the usage. But at the same time, still, we are keeping a very good number in terms of the social-based users and also the click-based users. And after Q2, we are going to see a very good improvement both in terms of the time spent, total time spent as well as the interactive volume. […] So in the long run, our overall objective of doing the update and changes of this existing product is that we would like to, first of all, get rid of those user experience that was primarily based on the relationship-based feed. And of course, at the current stage, there are still some of the challenges from the user side in terms of the acceptance and getting used to this new version. But still, in the long run, we have 2 objectives by doing this kind of change. First is that we hope that we are going to fully release the value of Weibo to those consumers.
p. 19 · Read in context →
Q3 2025 Earnings Call — Q3 2025
The clearest account of the feed rebuild and of why advertiser budgets are rotating back from performance to brand. · Open the full transcript →
Management sizes the feed rebuild against the shift to algorithmic sorting — and concedes near-term user pain.
Gaofei Wang (Chief Executive Officer, interpreted): The restructuring of the information feed was strategic significance for Weibo, which is comparable to our transition from the chronological to algorithm-based sorting several years ago. In the short term, user experience for certain user group may face some challenges. However, from a long-term perspective, the increased weight of recommendation content and video content will strengthen Weibo’s core competitiveness as a social media platform while laying a solid foundation for the sustainable and healthy development of our content ecosystem.
p. 3 · Read in context →
The only hard numbers on AI search scale: 70m MAU, DAU and queries up more than 50% sequentially.
Gaofei Wang (Chief Executive Officer, interpreted): In the third quarter, the MAUs of Weibo intelligent search product exceeded 70 million with its DAU and search queries increasing more than 50% quarter-over-quarter. This momentum not only reflects users’ recognition of Weibo’s intelligent search product, but also further contribute to the expansion of Weibo search ecosystem. As a result, the total search queries on Weibo increased 20% quarter-over-quarter in the third quarter.
p. 5 · Read in context →
Why brand budgets are coming back: performance bidding costs rose and a tax rule capped deductible feed-ad spend.
Gaofei Wang (Chief Executive Officer, interpreted): According to client feedback, after several years of substantial and continuous budget allocation towards performance ad, the bidding for the commercial traffic has become increasingly intense, which pushed their cost upward. In addition, the government recently issued tax policy that limit the cap of the feed ad spend for tax deduction purpose. This dynamic has driven clients to reevaluate their ad budget allocation, placing renewed emphasis on the value of the brand advertising.
p. 6 · Read in context →
The customer-concentration fact of the year: e-commerce up over 50% and Alibaba spend up 112% to $45.5m.
Cao Fei (Chief Financial Officer): Notably, the e-commerce sector recorded over 50% yearover-year growth, driven by similar policy amid a boosting domestic demand and consumption. […] Ad revenues from Alibaba reported robust growth of 112%, reaching USD 45.5 million in the third quarter.
p. 9 · Read in context →
Guidance philosophy: no 2026 number, only the event calendar and the subsidy risks that bracket it.
Alicia Yap (Citigroup); Gaofei Wang (Chief Executive Officer, interpreted): So you know that in 2025, we did not have any hot topics or hot trends or events happening. But in 2026, we are expecting several important events like the Winter Olympics and also the World Cup as well. […] So as a result, it is very difficult for me to give you a very precise prediction of our performance in 2026.
p. 11 · Read in context →
Q2 2025 Earnings Call — Q2 2025
The teaching call: fifteen years of feed architecture explained, plus the first real unit economics on AI advertising. · Open the full transcript →
How the feed evolved — reverse-chronological, then unread-post ranking in 2016, a split feed in 2018, now interest-first.
Gaofei Wang (Chief Executive Officer, interpreted): To be specific, the information feed were originally distribute — distributed in reverse chronological order based on the posting time. As content creation became more convenient for users, the explosive amount of content produced largely exceeded the amount of content consumed. And therefore, to improve content consumption efficiency, we upgraded the algorithm of information feeds from purely time line-based to focusing on distributing unread post from individual accounts being followed by users in 2016. Later in 2018, we introduced a new feed product structure composing of a relationship-based feed and an interest-based feed, aiming to broaden users’ content discovery and increase their content consumption scale. In recent years, users’ content consumption behaviors have been altered by the recommended content.
To adapt to this trend, we initiated a strategic revamp of our homepage information feed in the first half of this year, which makes the interest-based feed as a primary interface when user access Weibo.
p. 3 · Read in context →
The supply side of the new feed: cross-vertical KOLs make half the content, and traffic share shifts toward mid-tier creators.
Gaofei Wang (Chief Executive Officer, interpreted): Currently, over 50% of the interest-based content from key verticals are generated from cross vertical KOLs, which benefit from our years of deep cultivation in vertical areas and advantages of our vertical content operation. In the second quarter, vertical content consumption accounted for 60% of the interest-based feed consumption. And meanwhile, the new interest-based feed optimized content quality by allocating more traffic to high-quality authentic content. This has increased the traffic share for KOLs and selected accounts, while also providing more growth opportunities for mid-tier and long-tail KOLs.
p. 4 · Read in context →
The demand-side thesis: FMCG advertisers hitting diminishing returns on performance and seeding are moving money back to brand.
Gaofei Wang (Chief Executive Officer, interpreted): In the FMCG category, including food and beverage, footwear and apparel and personal care and beauty sectors, we’re seeing shifts in clients’ marketing strategies. After years of heavy investment in the e-commerce performance and KOC seeding, more and more advertisers now face diminishing return, which prompt a reconsideration of building. For instance, certain advertisers who had previously shifted most of their budget to performance-based marketing or influencer seeding are now reallocating budget towards selected endorsement, content IP creation, and sponsorship. While this transition is gradual and measured, we believe this trend is likely to continue.
p. 7 · Read in context →
AI in ads, quantified: over 10% of creative assets AI-made, eCPM up single digits, bigger lifts on leads than on app installs.
Felix Liu (UBS); Gaofei Wang (Chief Executive Officer, interpreted): In terms of ads, I think most of the platforms are alike. That means they are mostly concentrating on the performance-based ads. And for us, on one side, it’s about the auto placement of the AI assets. So in Q2, we launched our AI ad creative platform called [ Linchong ]. And right now, for the assets that is consumed, actually more than 10% is already from AI. And from the results, just now we already talked about it, for Q2 in the information feed ads, the eCPM grew by single digit, less than 10%. And then when it comes to CTR, I think for different clients, for different client types, things would be different. For the leads type, the CPR would be higher, maybe around 20%. But for the apps, maybe more than 10%. But comprehensively, the eCPM maybe grew by less than 10%.
p. 12 · Read in context →
The bottleneck on AI ads is not the model — brand clients must approve every asset, so adoption is capped near 10% this year.
Gaofei Wang (Chief Executive Officer, interpreted): So the overall result was pretty good. But for the brand clients, the biggest challenge is still in the restraints of the process of ad placement. So basically, for our brand customers, when they place the information feed ads, they require all the assets to be approved on their side. So that kind of work process for AI ads, which is quite customized for different people, it’s not really adaptive. So that really limits our customers, especially the brand customers when they want to use our AI ads at scale. So generally speaking, for the brand ads, I think if we can use AI ads on a large scale, the performance and the results would be even more obvious in terms of this improvement. But it may take some time for our customers to gradually accept it.
So we expect that at the end of the year, maybe more than 10% of our brand customers can start to use the AI ad system.
p. 13 · Read in context →
On search monetization: no business model exists yet in the industry, so grow the user base first.
Timothy Zhao (Goldman Sachs); Gaofei Wang (Chief Executive Officer, interpreted): And for the search ads, I just introduced that, of course, there are certain customers. They have some expectation on the monetization or commercialization. But for us or even in the industry, there’s no clear business model for this type of ads. So right now, we still focus more on building a bigger customer base and introducing more traffic. […] In terms of the revenue and commercialization, we’re in no hurry.
p. 14 · Read in context →
Q4 and Full Year 2024 Earnings Call — Q4 2024
The strategy-setting call: the 2025 agenda that produced the feed revamp and AI search, and the adoption of a formal dividend policy. · Open the full transcript →
The link management draws between cost discipline and optionality: stable profit is what funds the AI spending.
Gaofei Wang (Chief Executive Officer): Recapping on 2024, although revenue from a few industries fell short of expectations, which negatively impact on the overall revenue growth, our effective cost management enabled us to sustain a stable operating income. The solid profitability gives us financial flexibility to support our investment in product, technology, and AI area in 2025, which are cornerstones of the Company’s longterm development.
p. 5 · Read in context →
The feed revamp announced a year before it was finished — and the intent behind it stated as a traffic-mix goal.
Gaofei Wang (Chief Executive Officer): Second, we will upgrade our information feed product by optimizing the homepage interface. Coupled with the strength of the large language model powered interest-based feed, we hope to nurture users’ habit of consuming recommended content on the homepage, thereby raising the proportion of recommended content among traffic distribution. By doing so, we endeavor to offer fresh user experience while reinforcing the long-term development of the vertical content ecosystem.
p. 6 · Read in context →
The ambition behind AI search: move Weibo from real-time/trending search into general and vertical search.
Gaofei Wang (Chief Executive Officer): Based on the current user group tested, the updated version will improve user search experience on Weibo and drive usage frequency of Weibo’s search function. This will transform the positioning of Weibo search from hot trend and real-time search to general search, which will facilitate us to enter into the vertical search market. This potential transformation will also set a high standard for our product experience.
p. 9 · Read in context →
The dividend moves from an ad hoc payout to a standing annual policy, framed as sustainable and predictable.
Fei Cao (Chief Financial Officer): In light of Weibo’s robust balance sheet and healthy cash flow position, we are pleased to announce that our Board of Directors has adopted an annual cash dividend policy. […] Over the past 2 years, we have successfully distributed 2 rounds of bank or cash dividends, each totaling approximately USD 200 million.
Looking ahead, our top priority is to seize the transformative AI opportunities while maintaining robust financial health. Our efficient capital allocation supports our strategic priorities and ensure long-term financial stability, enable us to deliver sustainable, predictable dividends to our shareholders.
p. 12 · Read in context →
The subsidy-policy split: 3C, e-commerce and autos get a policy tailwind; discretionary categories get nothing.
Felix Liu (UBS); Gaofei Wang (Chief Executive Officer): So in terms of the national subsidy policy, this has been impacting immediately positively on the 3C products and e-commerce industries. So we’ve been seeing a very good growth of the ad revenue from these areas in Q4. However, in the other areas that are not enjoying this kind of policy, for instance, the beauty and personal care products and luxuries and also the other discretionary industries, we’ve been seeing a lot of pressures and also stress of growth.
p. 16 · Read in context →
Capital allocation stated as two principles, with buybacks explicitly left on the table.
Daisy Chen (Haitong International); Fei Cao (Chief Financial Officer): Weibo is focused on a balanced capital allocation strategy that supports long-term growth while delivering value to our shareholders. As we mentioned, over the past 3 years, our non-GAAP operating margin has remained stable and our operating cash flow reached around USD 600 million, giving us the flexibility to invest in AI, in product innovation, and shareholder returns. […] So going forward, we will continue to refine our capital allocation strategy, leverage AI to strengthen our product capabilities, and create long-term value for our shareholders.
p. 18 · Read in context →
Q1 2024 Earnings Call — Q1 2024
Where the user strategy behind today’s shrinking MAU was first spelled out, including what a high-value user costs to acquire. · Open the full transcript →
The ad playbook the company keeps returning to: hot-topic and new-product marketing rather than broad budget capture.
Felix Liu (UBS); Gaofei Wang (Chief Executive Officer, interpreted): And of course, another very important thing is that we have to refocus on the hot topic marketing and also some of the relevant areas like the hot topics of the festivals and also some of the IPs as well as the ecommerce focus, for instance, the 618 or Double 11 shopping festival.
And also, we have to pretty much focus on the new product marketing and also the new brand market as well.
p. 12 · Read in context →
A rare pricing observation: brand marketing prices better than performance, which is why the revenue mix matters.
Gaofei Wang (Chief Executive Officer, interpreted): And also, now you can see that if we’re comparing the brand-based marketing versus the effect-based advertisement still, we’ve been seeing the latter part, experiencing some of the pressures. And also, you can see that the pricing trend for the kind of brand-based marketing and advertisement is always better than the effectiveness based advertisement.
p. 15 · Read in context →
The user-acquisition economics: high-ARPU users cost 2–3x more, and cheap users were deliberately given up.
Daisy Chen (Haitong International); Gaofei Wang (Chief Executive Officer, interpreted): So that is to say that if we need to spend the budget in acquiring those users, we are going to focus on those users with a higher ARPU and also the users that are able to generate more content and also are more interactive. So normally, of course, the overall spending is around 2x to 3x more expensive than those users with a lower performance, but still, we’ve been seeing a very good positive trend. So still, we have tested that notion last year, and we’re going to keep doing so. So for instance, in Q1 of this year, we purposely gave up on some of the cheap to get or low-cost to get users in terms of their interactivity and also the ARPU generation. So we expect to have a very good DAU increase because of this focus. And also second, we do expect some of the frequency of the use and by switching on the Weibo app, for instance, really will focus on those high-frequency users.
p. 16 · Read in context →
Q1 2022 Earnings Call — Q1 2022
The shock call: Shanghai lockdown, an ad hit management called worse than 2020, and the cost rules they ran the business by. · Open the full transcript →
The starkest guidance Weibo has given: the Q2 ad impact would be worse than the 2020 COVID shock.
Fei Cao (Chief Financial Officer): The restriction and lockdown in major areas in China, especially Shanghai, has also negatively impacted consumption sectors such as FMCG and e-commerce, which suspended ad campaigns originally scheduled for the quarter and cut ad budget accordingly. Additionally, we also faced the major sales and ad campaign execution challenges due to lockdown in Shanghai. As COVID-19 resurgence rapidly invoked national wide and the restriction and lockdown disrupt economy activities, including production, consumption, logistics and offline activities. Based on our current observation and our best estimate, we expect the potential impact on advertising business in the second quarter is material and even more severe than the COVID-19 impact on our business in 2020.
p. 9 · Read in context →
Why brand revenue recovers more slowly than performance — the approval and planning cycle, not demand.
Alicia Yap (Citigroup); Gaofei Wang (Chief Executive Officer, interpreted): And also talking about the effectiveness or the performance ad, the impact to that particular category will be the minimized. And also, however, talking about the brand customers because they have the whole process, which is going to be followed, if they want to resume the kind of a budget and also resume the advertisements in terms of the budget allocation and in the marketing plans as well as the execution, etc. So, we expect that the brand customers are going to recover slower than the performance.
p. 12 · Read in context →
Concentration made explicit: half the business sits in three verticals, and all three snapped back within a month.
Gaofei Wang (Chief Executive Officer, interpreted): And also because 50% of our businesses are focusing on FMCG, luxury products as well as the automotive industry. So, you can see that these three verticals, they’ve been impacted heavily in April because of COVID. However, when there was a little bit recovery of the control and also containment of the COVID in May, we’ve seen a very quick and also robust rebound of these three verticals.
p. 12 · Read in context →
The channel-spend rule in plain terms: no payback in three to six months and the channel is cut.
Thomas Chong (Jefferies); Gaofei Wang (Chief Executive Officer, interpreted): Okay. So first of all, talking about the cost control, so first of all, we are having a stricter control and also a stricter policy in terms of the ROI and also keeping a quite preservative in terms of the placements among different channels and also the purchasing of the feeds, for example. And also talking about Q1, however, still we had stricter rules on the appraisal of ROI.
And also, if the channel, for example, cannot provide with us the returns as required within three months or six months, we are going to cancel collaboration with that channel.
p. 14 · Read in context →
Margin philosophy under stress: accept the decline, attack the cost structure, protect the financial metrics.
Fei Cao (Chief Financial Officer): But the management has reached a consensus that the highest priority in this year is to optimize our cost structure with more disciplined channel investment and other spending strategy. Weibo — as you know, Weibo, has always maintained a conservative status [Phonetic]. Our goal is improving operating efficiency with stricter ROI assessment to control our overall spending and striving for higher operating leverage to mitigate the margin decline as small as possible and ultimately keep our healthy financial metrics.
p. 14 · Read in context →
The answer on the user ceiling: video is what raises it, and engagement matters more than the MAU headline.
Tian Hou (T.H. Capital); Gaofei Wang (Chief Executive Officer, interpreted): So in terms of the video, the impact is actually going to be bigger than the social media. And also the business driving quarters are going to be more as well than the social media only. So, that’s why that even if we’ve had a lot of headwinds, as well as the market competition in the video content area, we’re still trying to invest as many as possible. And so we believe that when we have a very key positioning and also important positioning in the video area and then we are going to further uplift the upper limit of the number of users and also the others. And now in terms of the total traffic and data, the video part accounted for about one-third of the total traffic now we have. […] And also, lastly, I would like to say that, talking about the business value of a company, this does not only related to the DAU and also MAU number, but I think it’s more relevant to the activity of the users.
p. 16 · Read in context →
More calls
Q4 and Full Year 2025 Earnings Call — Q4 2025 · 16 pages · The full-year 2025 scorecard and the framing of the July feed upgrade one quarter before the 2026 plan; the archived capture holds only the opening prepared remarks, with no Q&A. · Open →
Q1 2025 Earnings Call — Q1 2025 · 21 pages · The DeepSeek switch quarter: why intelligent search will not be spun out as a separate app, and a candid read that AI lifted click-through roughly 10% but did little for ad revenue. · Open →
Q3 2024 Earnings Call — Q3 2024 · 21 pages · The best explanation of the value-added services line — membership growth traced to the high-quality-user strategy — plus how the Paris Olympics were monetized versus Tokyo. · Open →
Q2 2024 Earnings Call — Q2 2024 · 21 pages · Management sorts advertisers into three buckets and names the one where Weibo is structurally weakest: discount-driven, performance-only categories such as cosmetics and luxury. · Open →
Q3 2023 Earnings Call — Q3 2023 · 24 pages · Defines the "IP ecosystem" — hot topics, entertainment, sports, gaming — and sizes it at roughly 40–60% of platform traffic; the post-COVID vertical strategy in its original form. · Open →
Q2 2023 Earnings Call — Q2 2023 · 24 pages · Reopening-year pacing month by month, and the first framing of AIGC as a tool for mid- and long-tail creators rather than for the top accounts. · Open →
Q3 2022 Earnings Call — Q3 2022 · 15 pages · The trough of the ad recession: the mechanics of the cost-optimization programme, the 1–2x ROI hurdle applied to offline events, and the case for diversifying beyond advertising. · Open →
Q3 2021 Earnings Call — Q3 2021 · 27 pages · Regulatory exposure quantified vertical by vertical — education under 2% of revenue, insurance abandoned, fan-culture rectification — alongside the IDFA and splash-ad rule changes. · Open →
Weibo Corporation's annual reports contain management's most considered account of the business. These are the sections, passages and visual pages worth opening in the originals preserved in Sources.
Weibo Corporation — FY2025 Annual Report (Form 20-F) — FY2025
The latest full account of the platform, the VIE structure it is owned through, and a third straight year of ~$1.76bn revenue. · Open the full document →
Item 3. Key Information — Our Holding Company Structure and Contractual Arrangements with the VIEs and Their Respective Individual Shareholders — p. 7 · Read the full section →
States plainly what a shareholder owns: a Cayman shell whose consolidated revenue is 86% earned inside entities it does not own.
Holding-company framing and the share of revenue earned by the VIEs.
Weibo Corporation is not an operating company in China, but a Cayman Islands holding company with no equity ownership in the VIEs. […] Revenues contributed by the VIEs and their subsidiaries accounted for 87.0%, 86.2% and 85.9% of our total revenues for the years of 2023, 2024 and 2025, respectively.
p. 7 · Read in context →
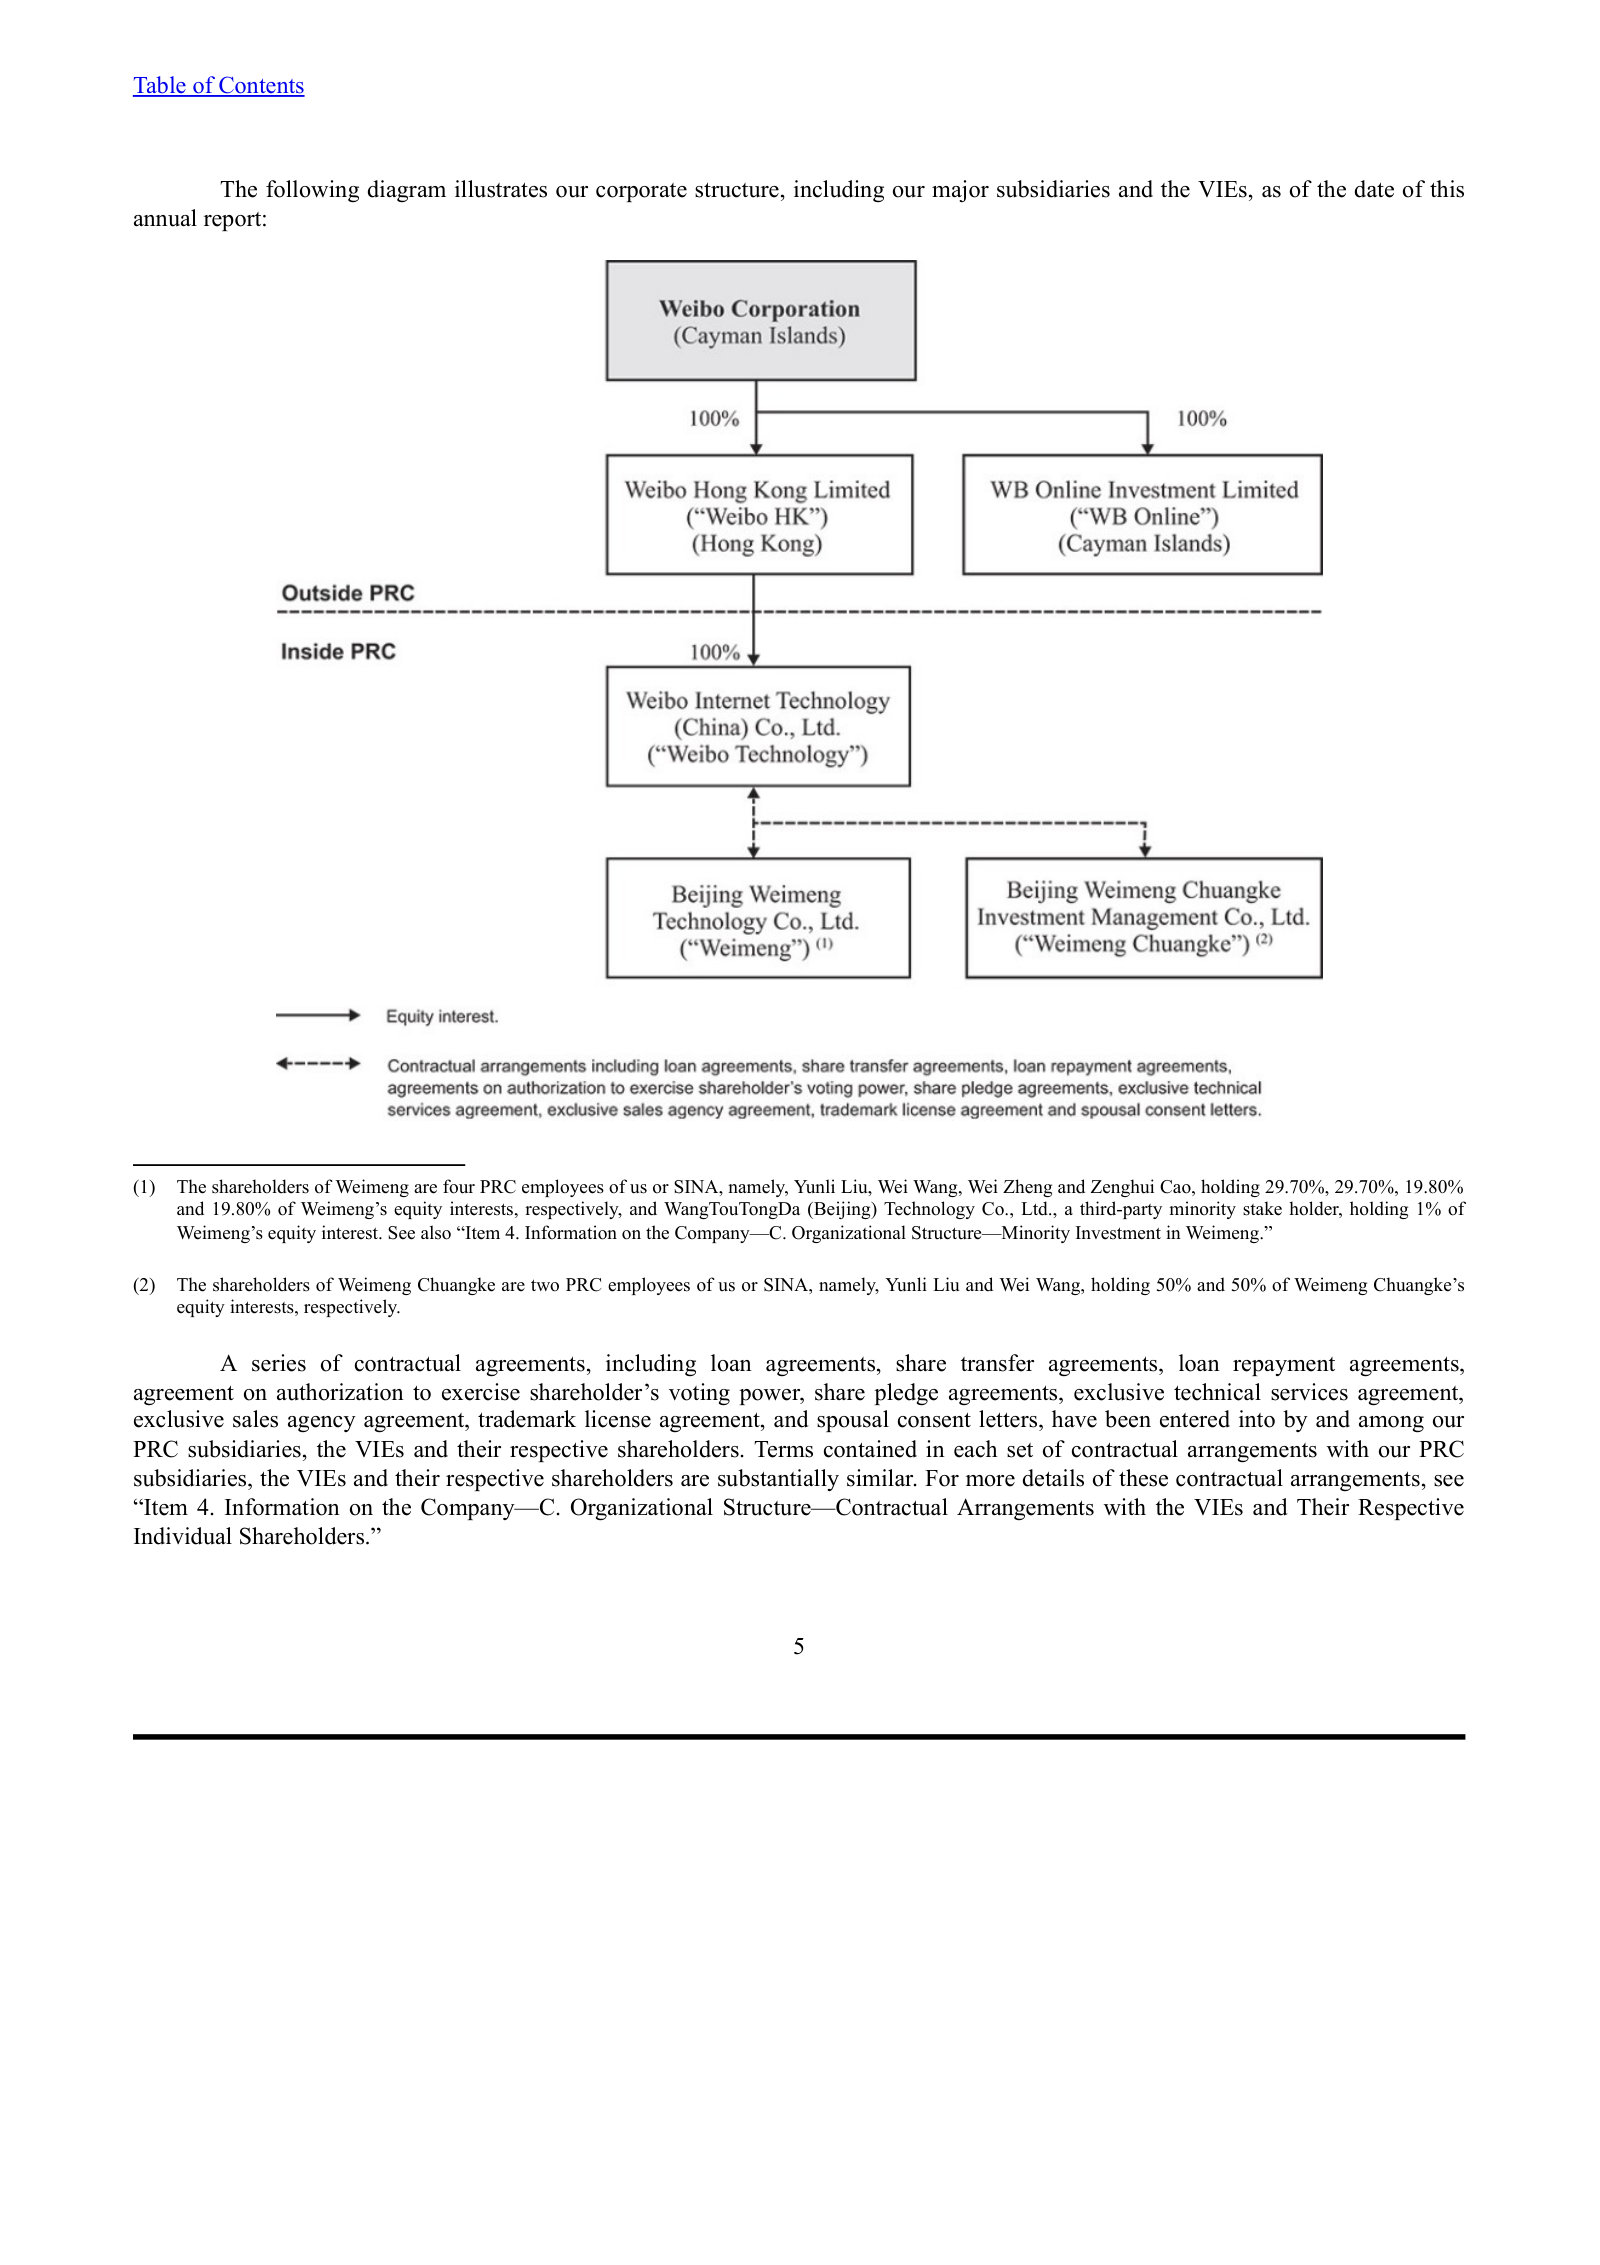
Financial Information Related to the VIEs — p. 15 · Read the full section →
The condensed consolidating schedule separates the holding company, the WFOE and the VIEs — where the revenue and the profit actually sit.
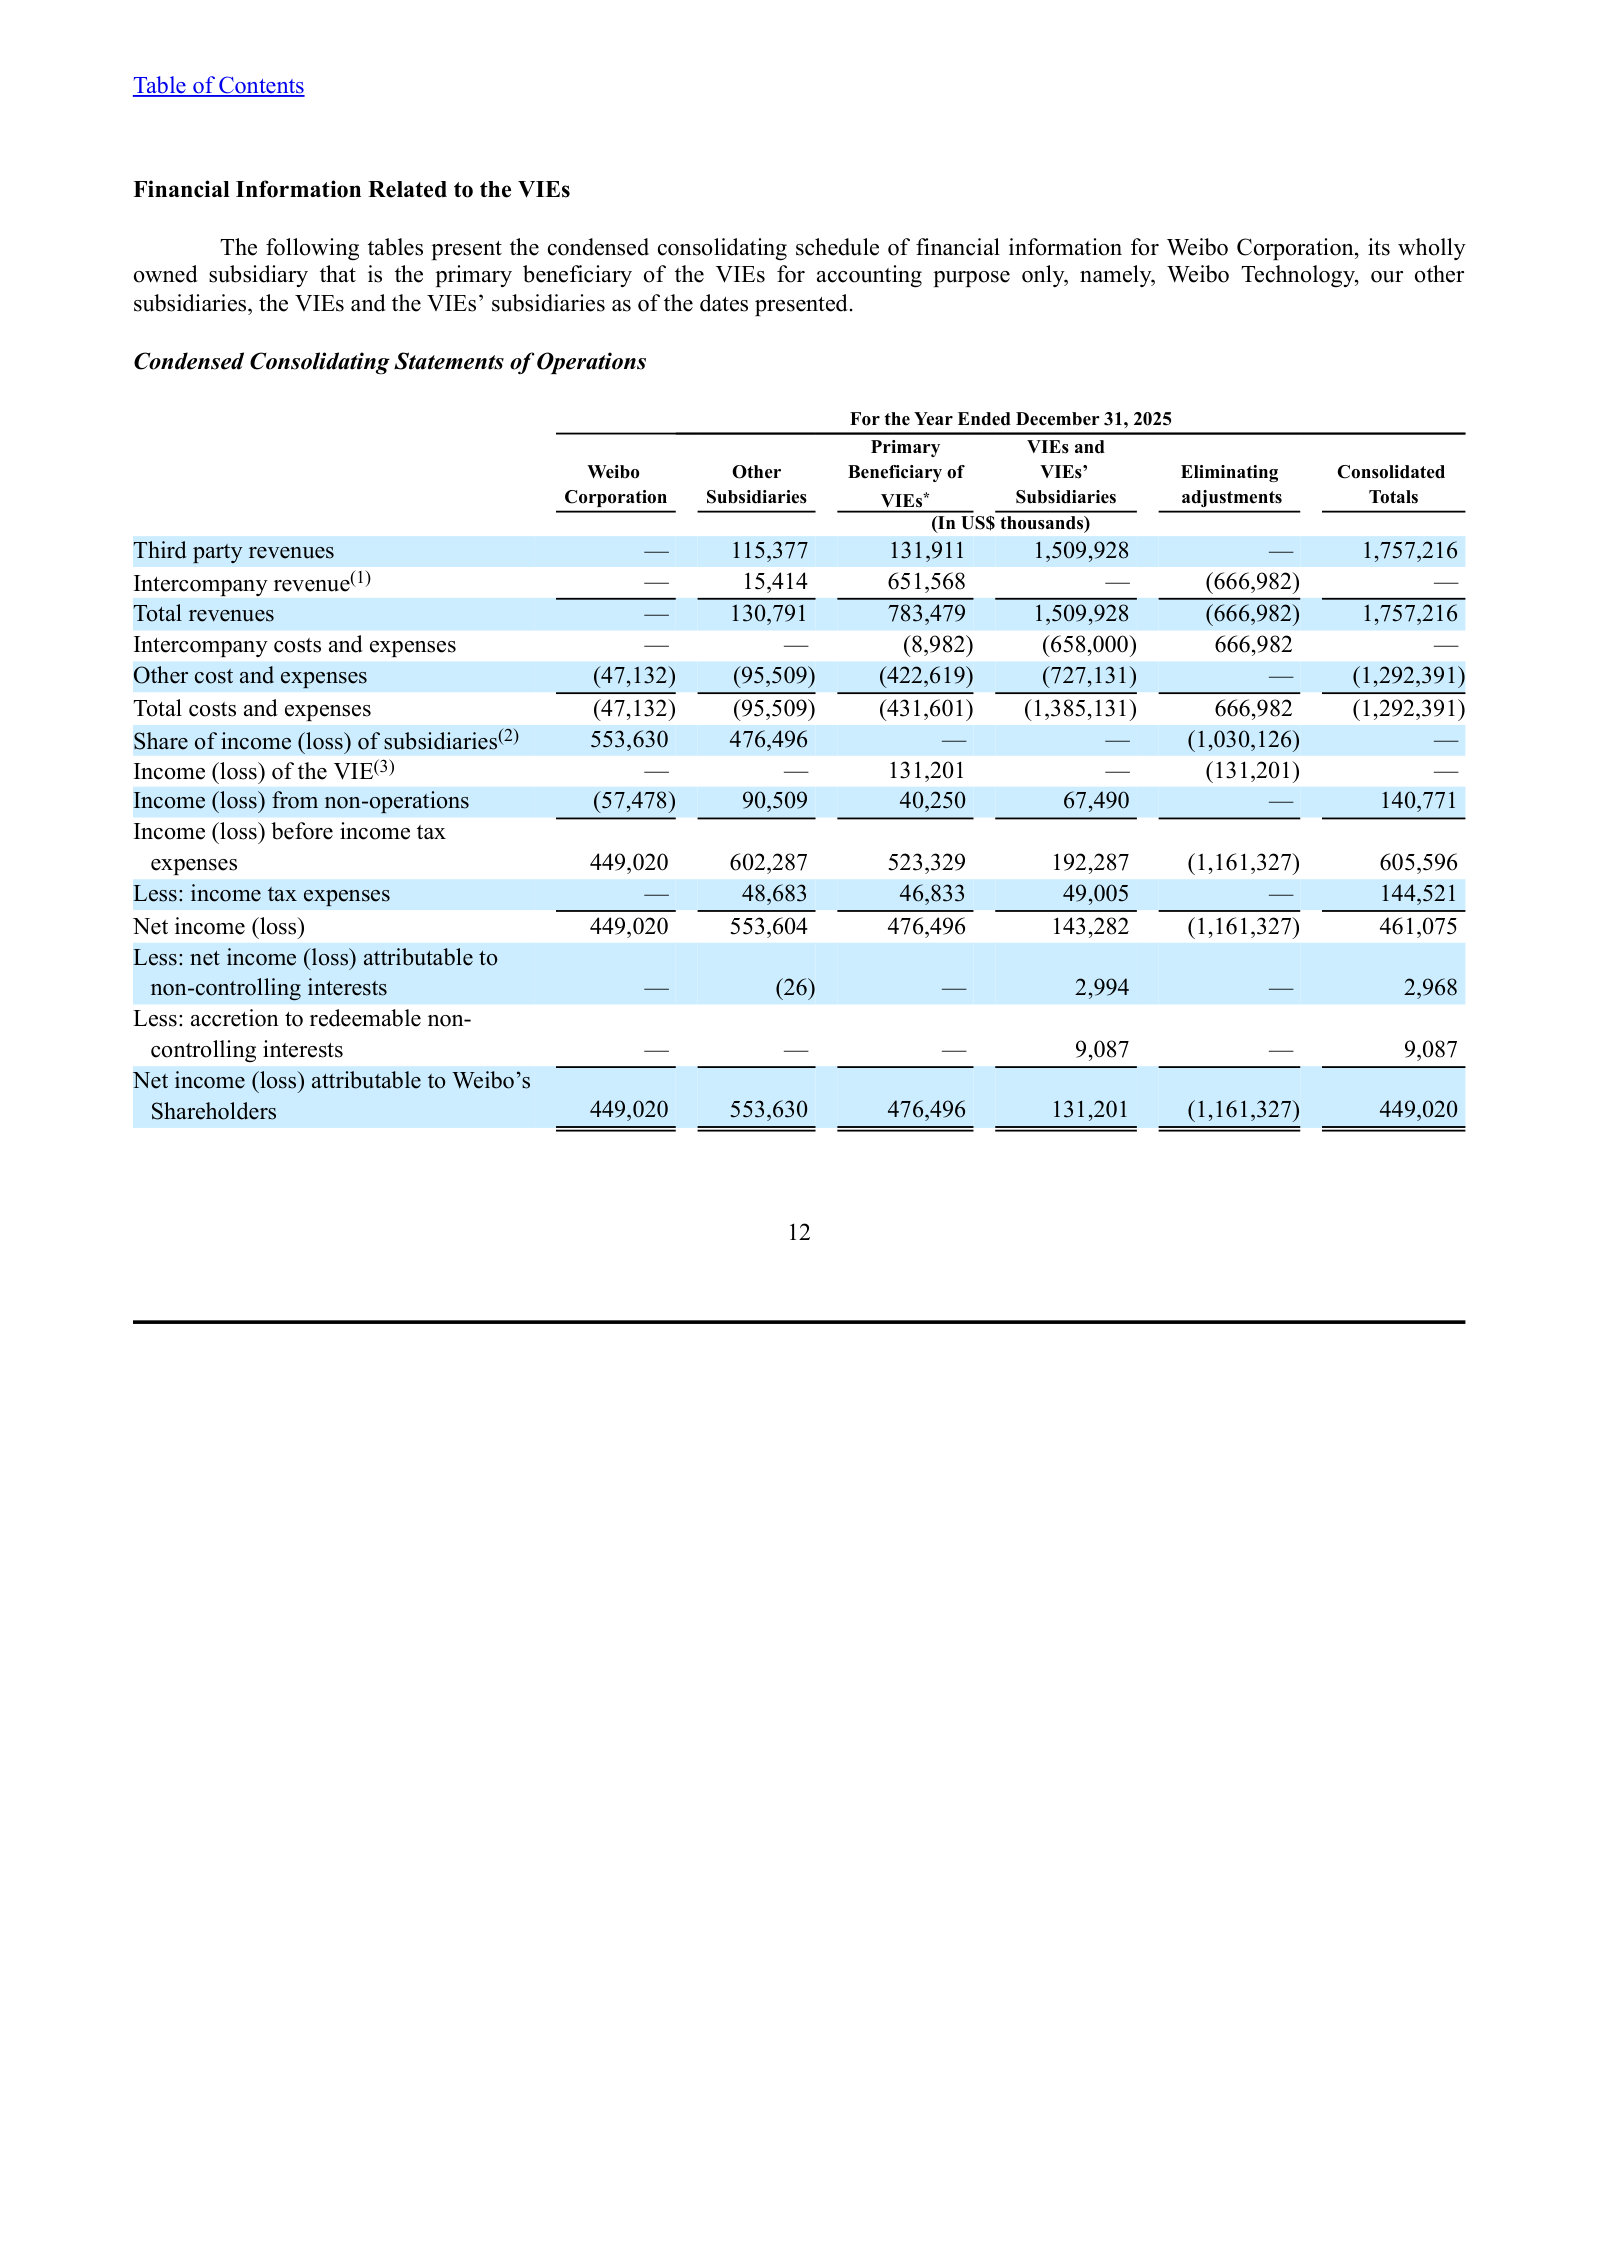
If we are unable to compete effectively for user traffic or user engagement, our business and operating results may be materially and adversely affected. — p. 26 · Read the full section →
Names the specific apps taking Chinese social time — the competitive set that explains four flat revenue years.
The named competitive set, from WeChat to Douyin and RedNote.
Competition for user traffic and user engagement is intense and we face strong competition in our business. It is possible that a new product could gain rapid scale through harnessing a new technology (such as generative AI), or a new or existing distribution channel, creating a new or different approach to connecting people or some other means. Major Chinese internet companies, such as Tencent and Bytedance, compete directly with us for user traffic and user engagement, content, talent and marketing resources. […] These services include (i) messengers and other social apps and sites, such a Weixin/WeChat; (ii) multimedia apps (such as photo, video and live streaming apps), such as Douyin/TikTok, Kuaishou, Bilibili Xiaohongshu (also known as RedNote), iQiyi, Tencent Video and Youku; and (iii) news apps and sites operated by other major internet companies, such as Tencent and Bytedance.
p. 26 · Read in context →
Alibaba is a significant customer and an important strategic partner of ours. If we fail to maintain our collaboration with Alibaba, our results of operations and growth prospect may be adversely and materially affected. — p. 30 · Read the full section →
Alibaba supplied $173.8m of FY2025 advertising revenue and all of the year's growth; here that dependence is disclosed.
Alibaba as shareholder, partner and customer at once.
Alibaba is an important strategic partner, a major shareholder and a significant customer of ours since our IPO in 2014. […] If we are unable to either maintain strong cooperation with Alibaba or find other customers that can bring in similar amount of revenues to offset the possible decline of revenue from Alibaba or the revenue associated with Alibaba’s ecosystem, our results of operations and growth prospects may be adversely and materially affected.
p. 30 · Read in context →
User misconduct and inappropriate content may adversely impact our brand image, business and results of operations, and we may be held liable for information or content displayed on, retrieved from or linked to our app or website or distributed to our users. — p. 36 · Read the full section →
For a Chinese public-conversation platform, content liability is the operating risk: fines and service suspensions, not lawsuits.
Content moderation as a regulatory exposure.
While we have developed technologies and a series of measures to detect inappropriate content and activities, we cannot guarantee that we will be able to fully prevent inappropriate content from being posted on our platform or inappropriate activities from being carried out on our platform. […] It is possible that our users may engage in conversations or activities on our platform that may be deemed illegal under applicable laws and regulations. We may be subject to fines or other disciplinary actions, including suspension of certain services, if we are deemed to not have taken actions to stop user misconduct […]
p. 36 · Read in context →
If the PRC government determines that the contractual arrangements constituting part of the VIE structure do not comply with PRC regulations on foreign investment in internet and other related businesses, or if these regulations or their interpretation change in the future, we could be subject to severe penalties or be forced to relinquish our interests in those operations — p. 50 · Read the full section →
The structural risk stated at its sharpest — control rests on contracts, and the shares carry no equity in the operating entities.
Contractual control, consolidation under U.S. GAAP, and what investors actually buy.
As a result of these contractual arrangements, we exert control over Weimeng and Weimeng Chuangke and treat them as consolidated VIEs. Consequently, we consolidate their operating results in our financial statements under U.S. GAAP. […] Investors of our Class A ordinary shares and/or the ADSs are not purchasing equity interest in the VIEs in China but instead are purchasing equity interest in a Cayman Islands holding company with no direct equity ownership of the VIEs.
p. 50 · Read in context →
Item 4. Information on the Company — B. Business Overview — p. 86 · Read the full section →
Management's own description of the platform and its scale, plus the definitions that govern how advertising revenue is booked.
Platform description and December 2025 user scale.
Weibo is a leading social media platform in China for people to create, discover and distribute content. […] We had 567 million MAU and 252 million average DAUs in December 2025.
p. 86 · Read in context →
Who the customer is: the agency, not always the advertiser.
We consider the ultimate beneficiary of our online advertising services as an “advertiser,” meaning the party whose products, brand awareness or marketing activities benefited from the execution of advertisement. We consider a party that we enter into an advertisement service contract with as our “customer” from accounting perspective. As such, we treat an advertising agency who enter into an advertisement service contract with us as our customer, and such advertising agency may represent and serve multiple advertisers.
p. 89 · Read in context →
Item 5. Operating and Financial Review and Prospects — Results of Operations — p. 137 · Read the full section →
Three years side by side, then management's explanation of a flat top line: fewer advertisers spending more, and Alibaba filling the gap.
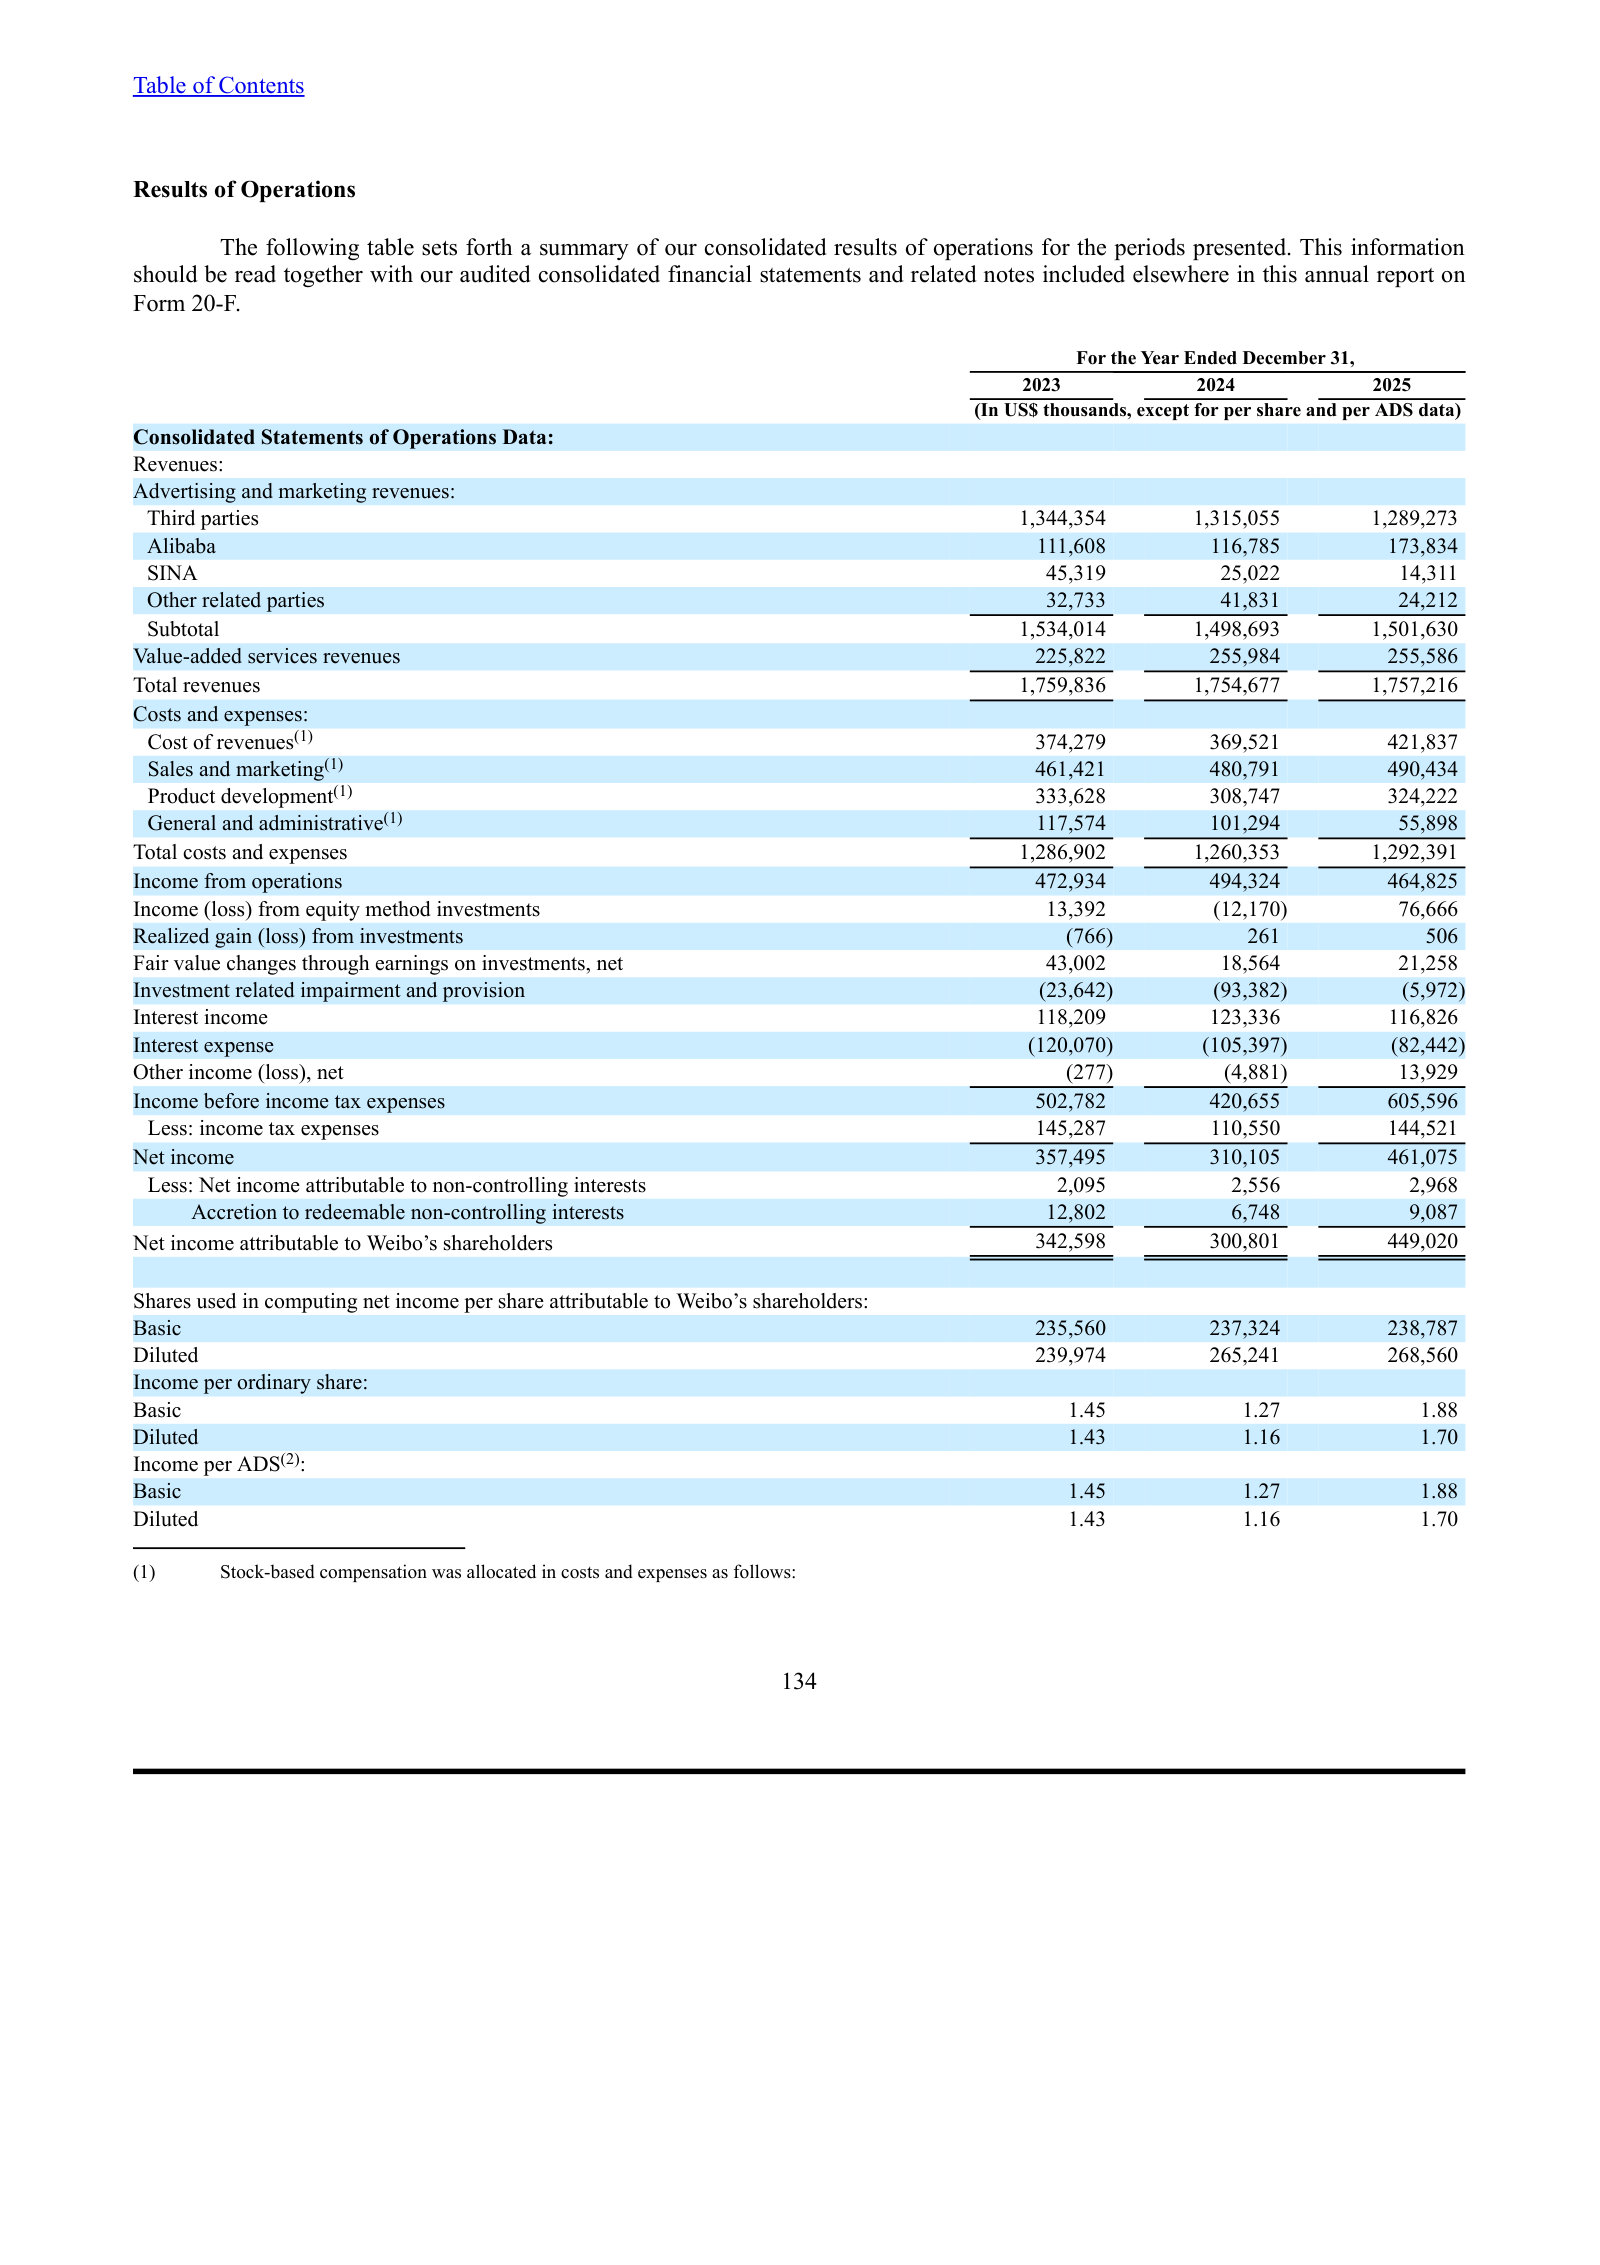
Advertiser count, spend per advertiser and the Alibaba contribution in 2025.
Advertising and Marketing Revenues. Advertising and marketing revenues were US$1,501.6 million in 2025, remaining relatively flat compared to US$1,498.7 million in 2024. The total number of advertisers was 0.4 million in 2025, compared to 0.6 million in 2024, while the average spending per advertiser (excluding Alibaba) increased by 39% from US$2,438 in 2024 to US$3,385 in 2025, both of which were primarily due to the churn of advertisers with relatively lower advertising budgets. […] Revenues from advertising customers (excluding Alibaba) decreased by 4% from US$1,381.9 million in 2024 to US$1,327.8 million in 2025, mainly attributable to fierce market competition. Revenues generated from Alibaba increased by 49% from US$116.8 million in 2024 to US$173.8 million in 2025, driven by deeper collaboration between Alibaba and us during key e-commerce marketing windows.
p. 138 · Read in context →
Note 2. Significant Accounting Policies — Revenue recognition — p. 209 · Read the full section →
Defines the revenue model: campaigns booked gross with creator payouts in cost of revenues, and direct versus agency customers.
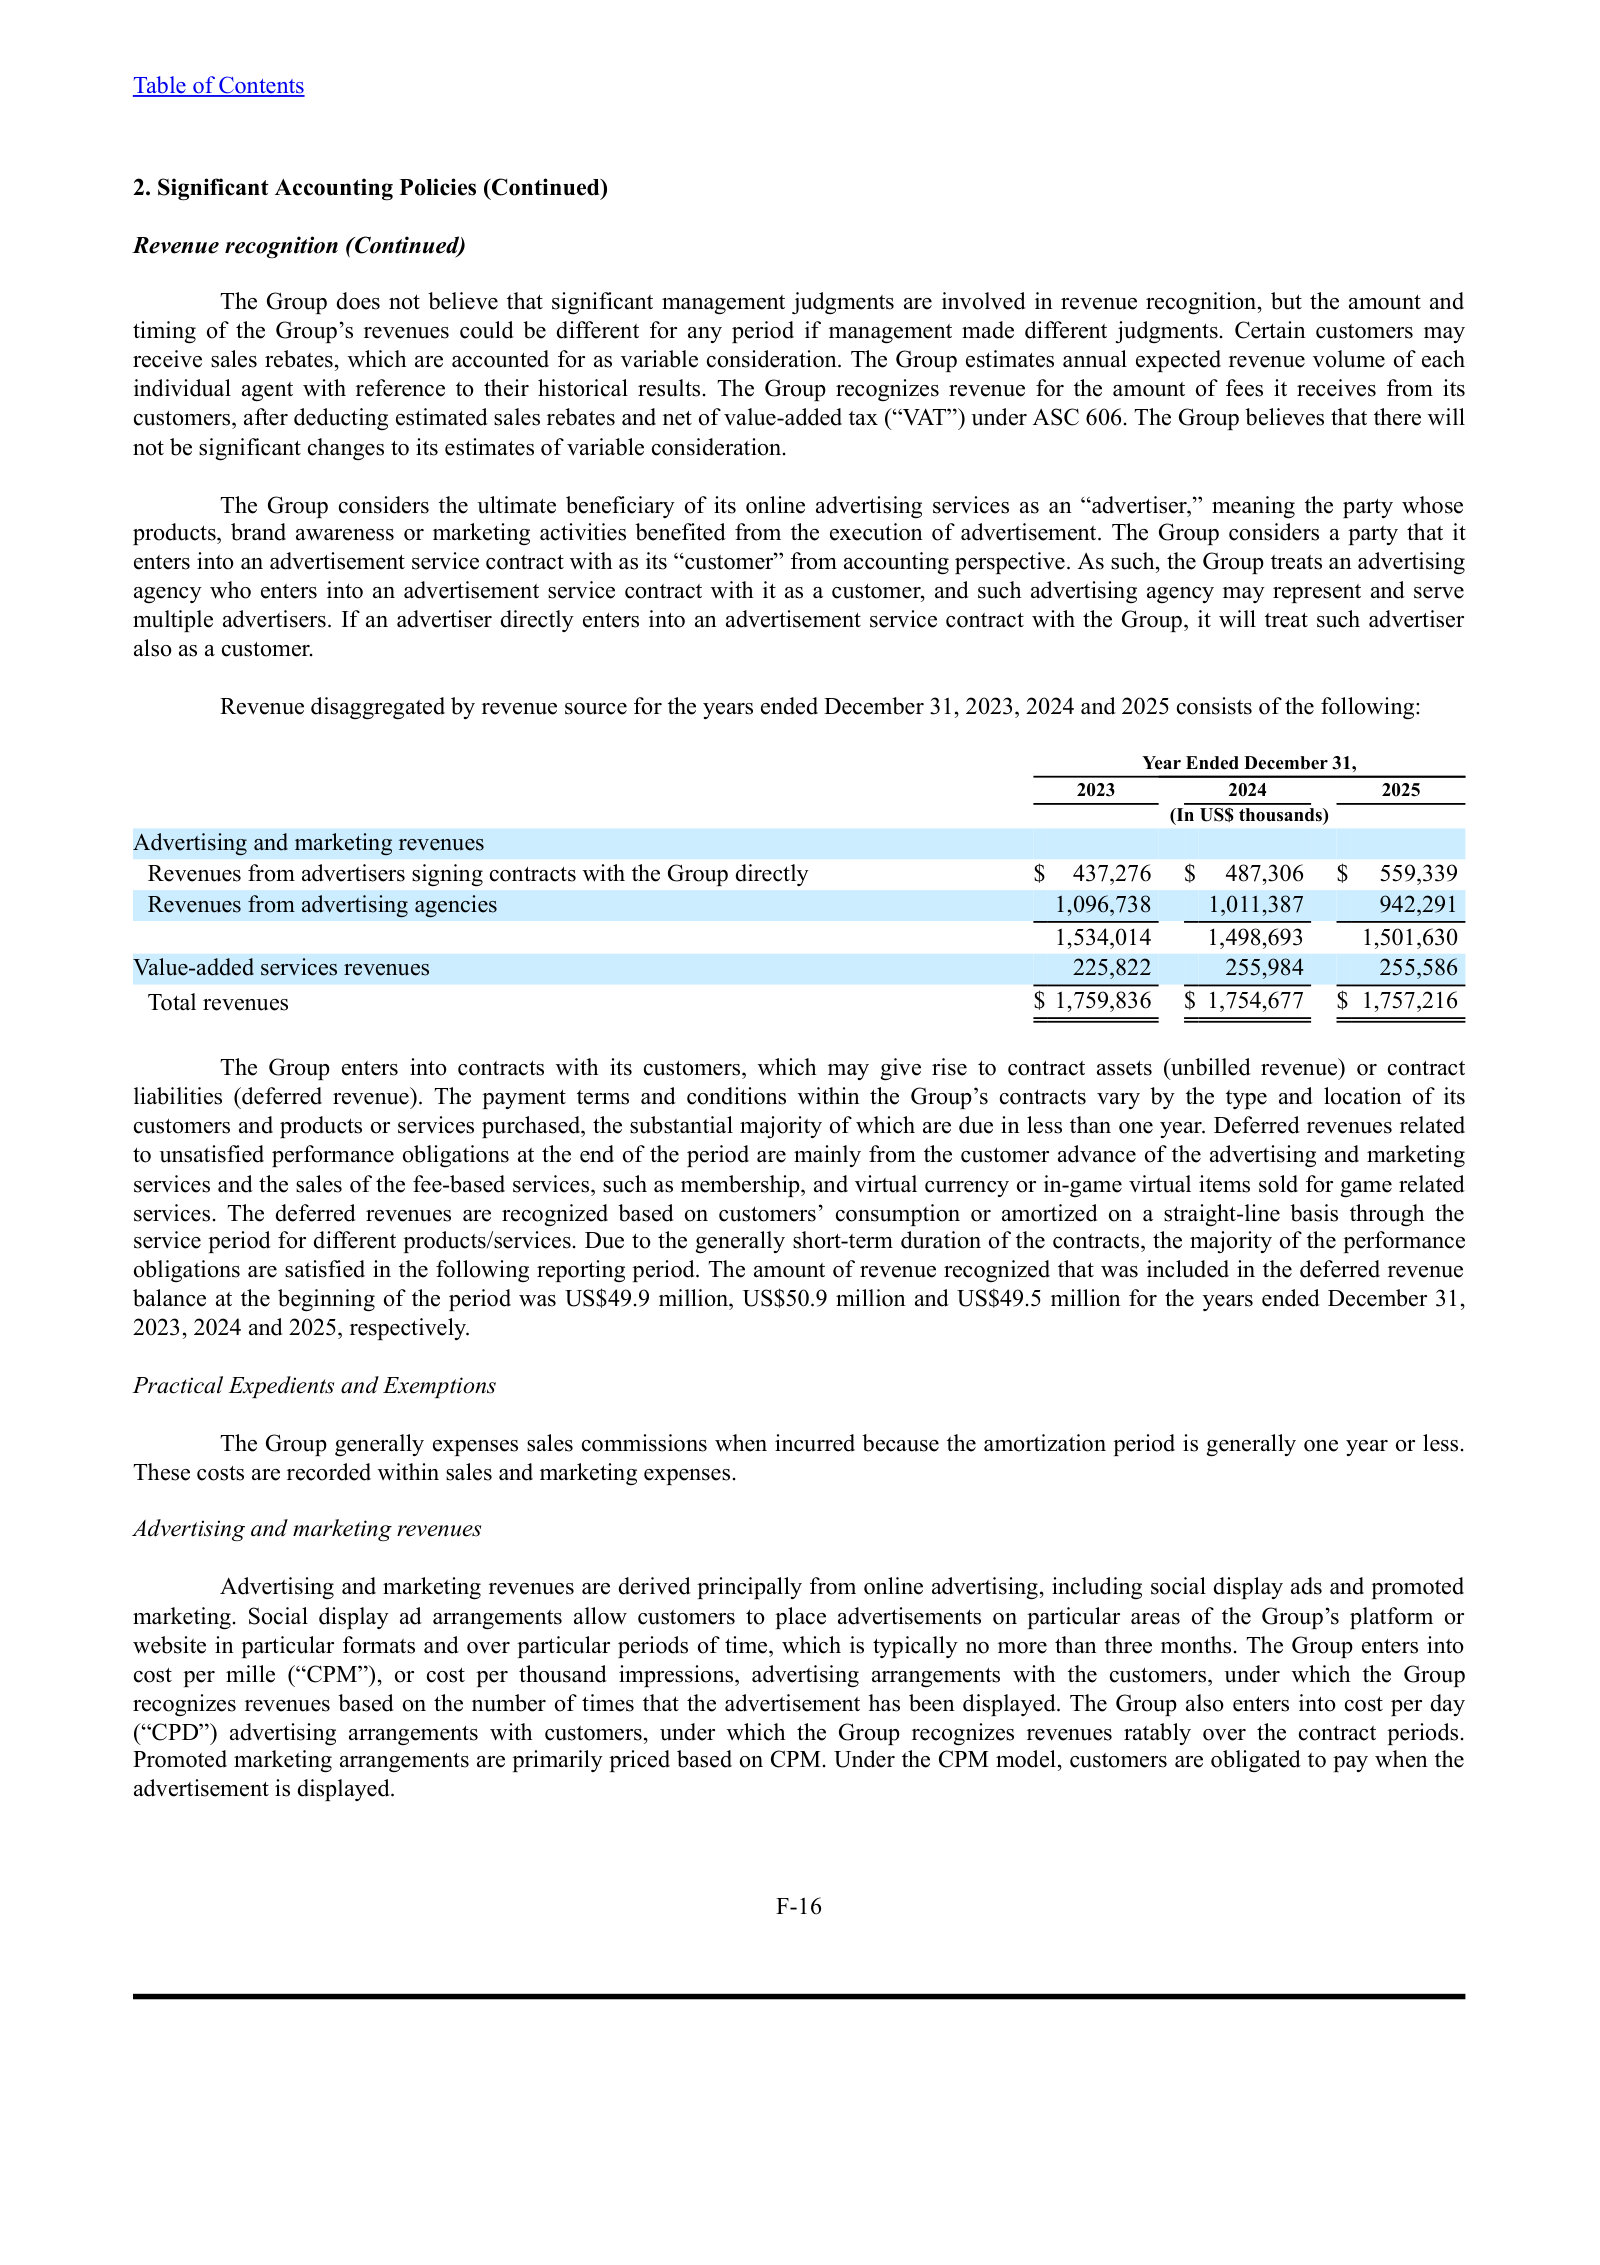
Why creator payouts sit in cost of revenues rather than netting against revenue.
Contracts with customers of online advertising may require cooperation from third parties. The Group pays a predetermined portion of revenues earned from advertising contracts to the third parties such as key opinion leaders who participate in advertising and promotion activities by monetizing their social assets. The Group has determined that it is the principal in these transactions […] The Group records revenues derived from such contracts on a gross basis and the portion paid to the third parties is recognized as cost of revenues
p. 211 · Read in context →
Weibo Corporation — FY2021 Annual Report (Form 20-F) — FY2021
The peak-revenue edition, kept for one section: results reported on a customer taxonomy Weibo has since stopped disclosing. · Open the full document →
Item 5. Operating and Financial Review and Prospects — Results of Operations — p. 120 · Read the full section →
The peak year — $2,257.1m of revenue — and a customer disaggregation (key accounts versus SMEs) the company no longer publishes.
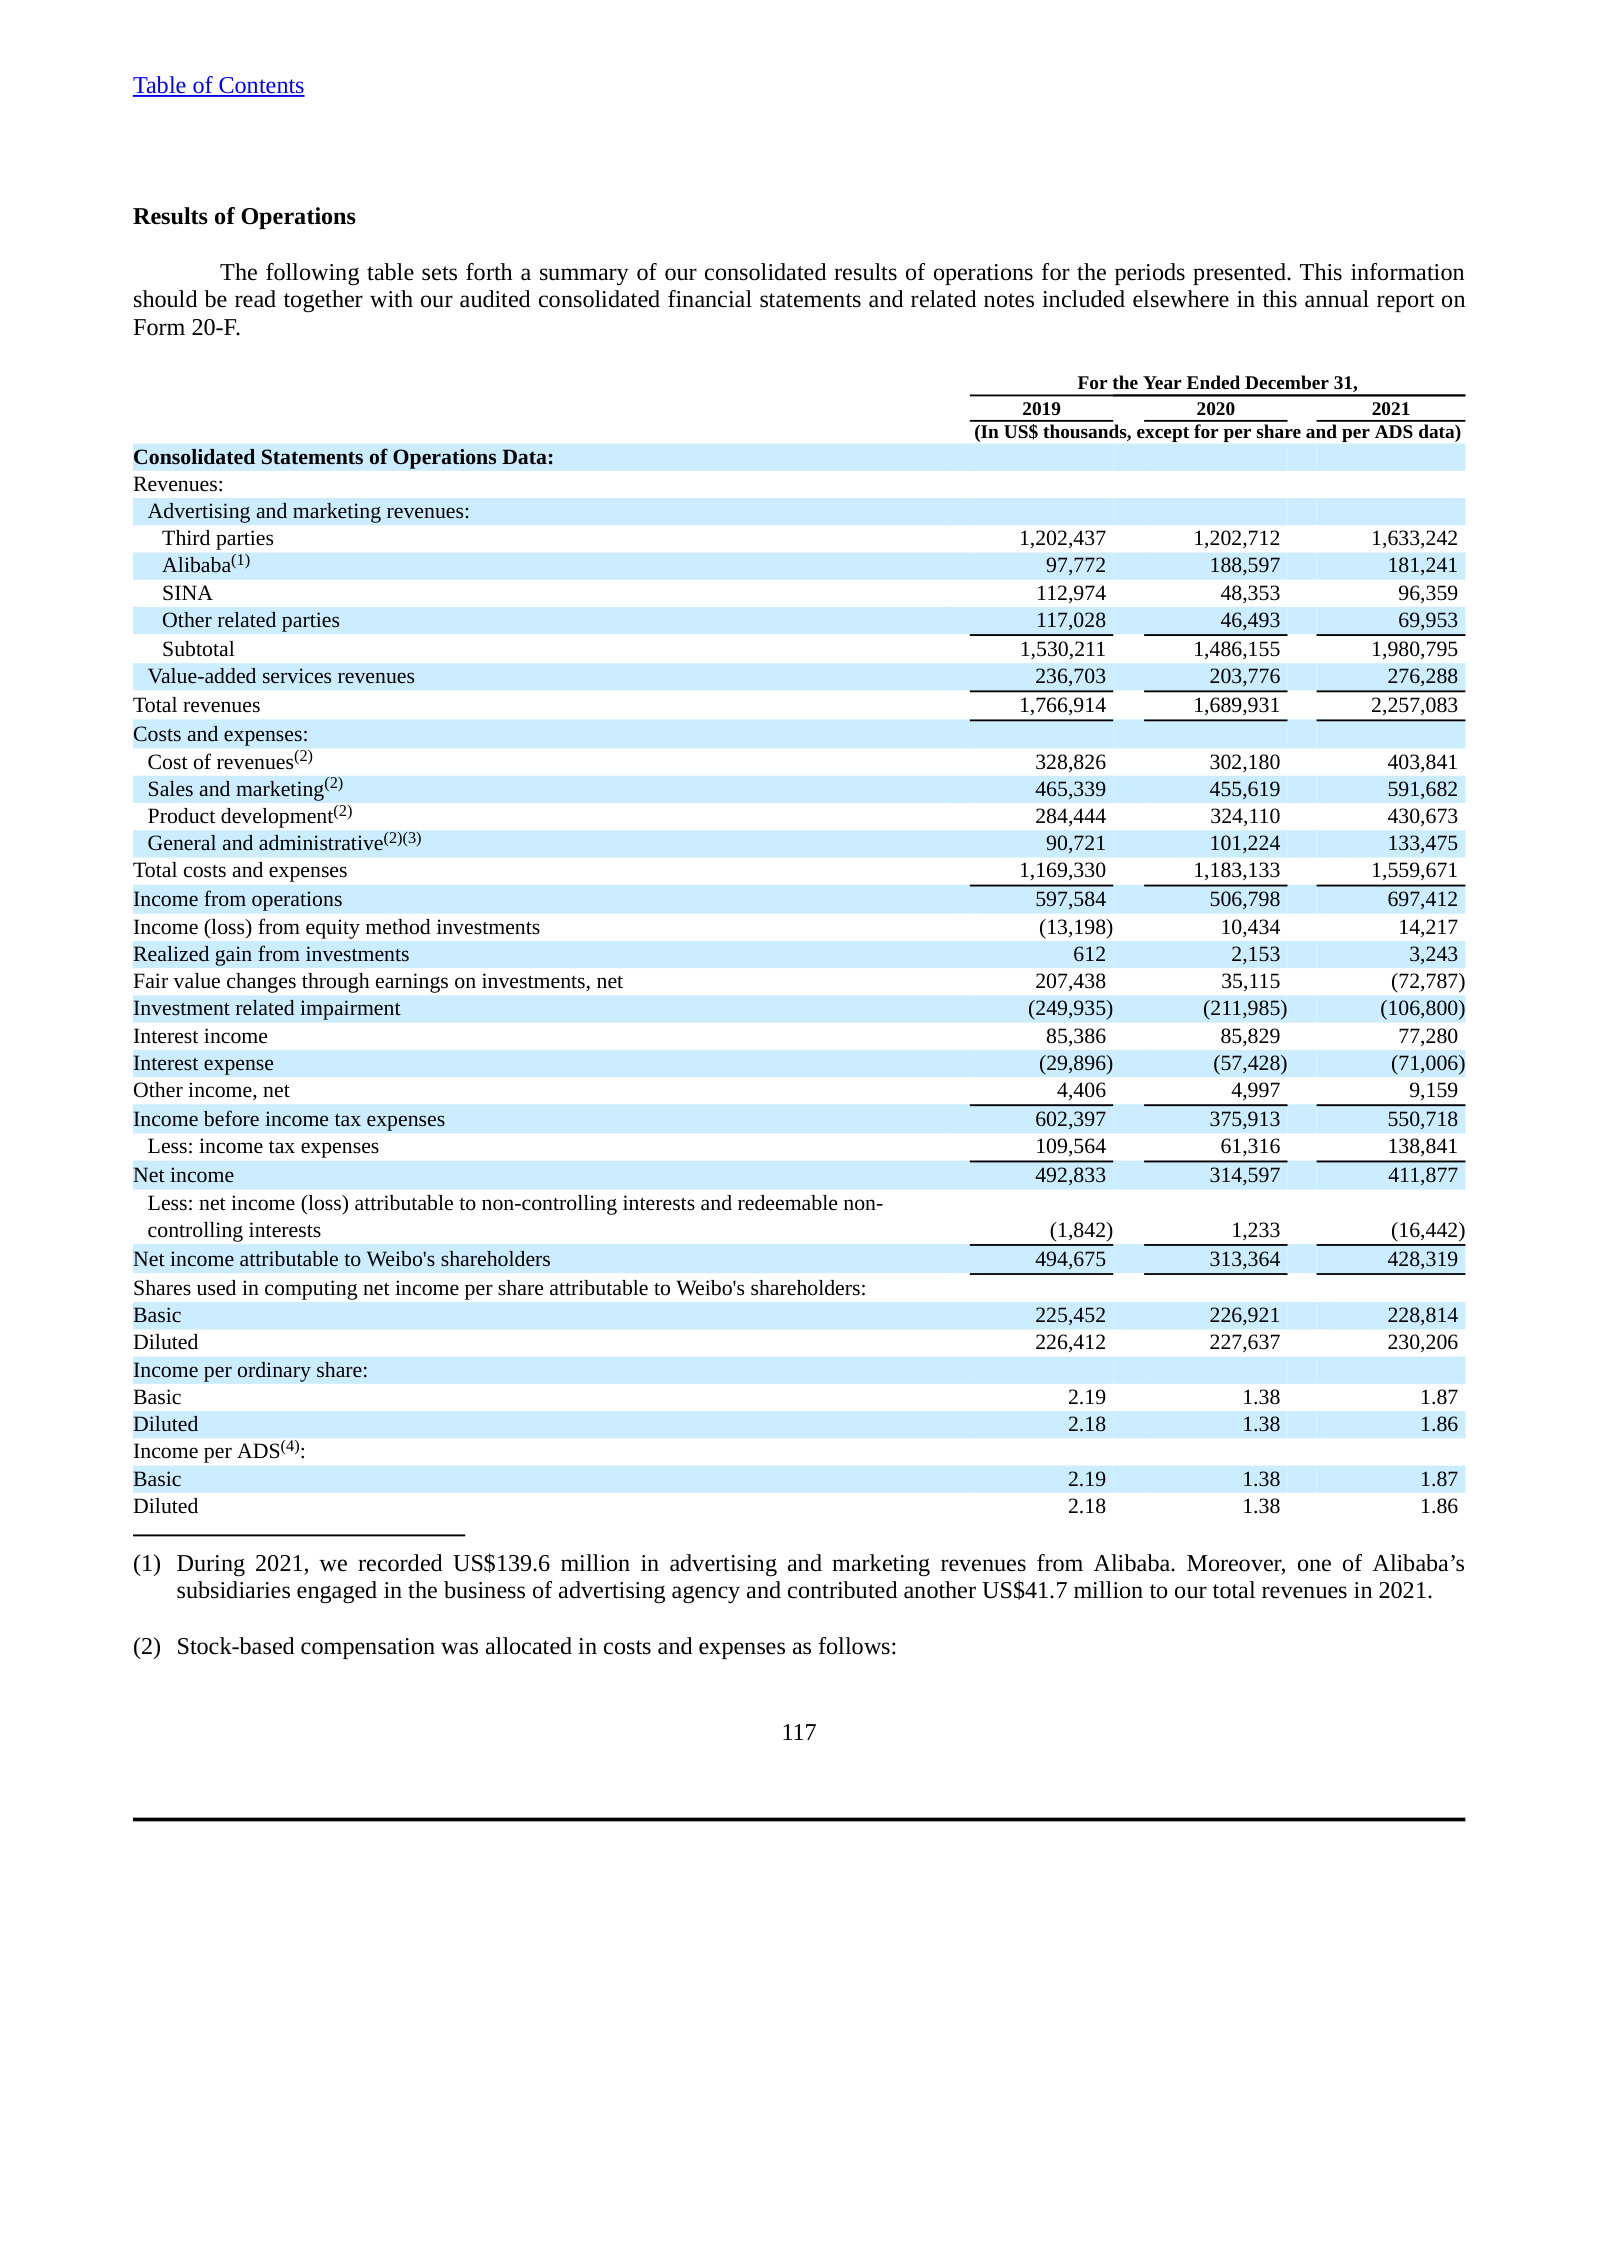
The key-accounts / SME split, discontinued in later filings.
Revenue from key accounts grew by 2% from US$729.3 million in 2019 to US$741.5 million in 2020, largely attributable to the strong relationship between Weibo and brand advertising customers […] Revenue from SMEs decreased by 16% from US$703.2 million in 2019 to US$592.7 million in 2020, mostly due to the relatively slower recovery pace of the SME sector during the COVID-19 pandemic and intense market competition.
p. 122 · Read in context →
More annual reports
Weibo Corporation — FY2024 Annual Report (Form 20-F) — FY2024 · 259 pages · Prior-year baseline for the FY2025 comparisons, including the $93.4m of investment impairments taken that year. · Open →
Weibo Corporation — FY2023 Annual Report (Form 20-F) — FY2023 · 522 pages · The year the first special dividend was declared, and the start of the three-year window shown in FY2025. · Open →
Weibo Corporation — FY2022 Annual Report (Form 20-F) — FY2022 · 487 pages · Filed while Weibo was a Commission-Identified Issuer under the HFCAA; documents the revenue decline from the 2021 peak. · Open →
Competitors describe Weibo Corporation's market in their own filings and calls. These verified passages and visual pages show where their strategies meet, using source documents preserved in Sources.
Bilibili Inc. (BILI)
The peer whose advertising business has drawn level with Weibo's. Bilibili sells the same product Weibo sells - brand and performance advertising against a Chinese social content community, priced off user attention rather than transactions - and in 2025 it booked RMB10.1 billion of advertising revenue, roughly US$1.44 billion at the RMB6.99/US$ rate iQIYI's filing implies, against Weibo's US$1.50 billion. The two are now within about 4% of each other, having arrived from opposite directions: Bilibili's advertising grew 23% in 2025 and 30% in the March 2026 quarter, its thirteenth consecutive quarter of double-digit growth, while Weibo's advertising and marketing revenue has been flat at US$1.50bn/US$1.50bn/US$1.53bn across 2025/2024/2023. The vertical overlap is close to complete - Bilibili's top five verticals are games, digital products and home appliances, internet services, e-commerce and automotive, which is a fair description of Weibo's key accounts too - and Bilibili is explicit that it is taking share rather than riding a growing market. Its user base is smaller than Weibo's (368m MAUs, 112m DAUs against Weibo's 567m and 252m) but it discloses something Weibo does not: 108 minutes of daily time spent per user, growing.
Bilibili's own account of its 2025 advertising year, from the Q4 FY2025 call held 5 March 2026. Full-year advertising revenue of RMB10.1 billion, up 23%, with the December quarter accelerating to RMB3.0 billion and 27%. Two things matter for a Weibo reader. First, scale: at the ~RMB6.99/US$ rate implied by peer filings, RMB10.1bn is about US$1.44 billion against Weibo's US$1.50 billion of advertising and marketing revenue in the same year, so a business Weibo comfortably out-earned a few years ago is now essentially the same size and growing more than 20 points faster. Second, mix: the top five verticals named here - games, digital products and home appliances, internet services, e-commerce, automotive - map closely onto the categories Weibo depends on, and the two fastest-moving lines Bilibili cites (home decoration up over 80%, AI-related budgets up nearly 180%) are consumer and technology budgets that have to come from somewhere. 'Industry-leading growth' is Bilibili's characterisation of its own numbers, not an independent measurement.
Rui Chen (Chairman and CEO), prepared remarks: First, we were very encouraged to see our advertising business deliver better-than-expected results in Q4. Advertising revenues accelerated to RMB 3.0 billion, up 27% year-over-year and full year advertising revenues increased by 23% to RMB 10.1 billion. This industry-leading growth reflects both the rising value of our user base and our continued progress in improving ad efficiency. […] In Q4, the top 5 ad verticals were games, digital products and home appliances, Internet services, e-commerce and automotive. Home decoration was a standout with ad spend jumping over 80% year-over-year, another strong signal that our users are maturing and seeking more lifestyle-focused upgrades. AI advertisers also ramped up with AIrelated ad budgets climbing nearly 180% year-over-year in Q4, and that momentum has carried into 2026.
p. 5 · Read in context →
Bilibili management's stated view of how Chinese ad budgets are being redistributed, given in answer to a question about second-half industry trends on the Q2 FY2025 call. The claim is consolidation: advertisers are cutting the number of platforms they buy and concentrating spend on the ones they consider 'indispensable and unique,' and the winners will take a larger share of a client budget that is not itself growing. That framing is a description of the mechanism by which Bilibili's advertising can grow 20-30% while Weibo's stays flat, and it is the sharpest articulation in this file of the structural risk to a mature social platform that is neither the largest reach buy nor a closed-loop conversion channel. The second half of the passage - the argument that brand budgets will return and that young users are unignorable - is Bilibili's pitch for its own positioning, and the closing promise of 'growth above industry average' is guidance, not fact.
Bilibili management (interpreted), answering Miranda Zhuang, Bank of America Securities: From industry vertical standpoint, in the near term, we think the advertisers’ budget are migrating from multiple platforms to a few core platforms, platforms that are indispensable and unique will capture larger shares of the client budget. And in the longer term, as China’s consumer market involves advertiser will be placing more emphasizing on building their brands on top of the pure sales conversion budget because no advertiser can afford to ignore the influence and purchasing power of young people. […] So in summary, whether in long term or short term, as long as our community continue to thrive, the value of Bilibili’s advertising business will become increasingly evident over time. We remain confident in our ability to sustain the growth above industry average.
p. 12 · Read in context →
Autohome Inc. (ATHM)
Weibo's own 20-F says it competes with 'digital media tailored to vertical industries, such as automobile and IT.' Autohome is that company. It is China's largest auto-vertical media platform (77.5 million mobile DAUs in December 2025 on QuestMobile data, first among automotive service platforms), it sells brand advertising to the same automakers that buy Weibo's auto campaigns, and its competition section names Sina - Weibo's controlling shareholder and the portal whose automotive channel sits alongside Weibo in an OEM media plan - as a direct competitor. Autohome matters here less as a share rival than as the cleanest available thermometer for a vertical Weibo depends on and does not break out. Autohome's media services line is almost pure automaker brand advertising, and it fell 24.3% in 2025 to RMB1,153.4 million after falling 18.6% in 2024 and 4.7% in 2023 - a three-year contraction of roughly 41% - which management attributes to the OEM price war, dealer losses and shrinking internal-combustion volumes rather than to share loss. Anyone modelling Weibo's auto vertical is modelling the same budget pool, measured here by a company that has to report it as a separate line.
Autohome's competition section from its FY2025 Form 20-F. It is one of the few places in this file where a peer names the subject's group: 'the automotive channels of major internet portals, such as Sina and Sohu' sit in the same sentence as BitAuto, Dongchedi, Xcar and PCauto, followed immediately by 'companies engaged in mobile social media, news, video and live-streaming applications' - the category Weibo occupies. The second passage adds ByteDance and Tencent as social-media competitors. Read as a market map rather than a ranking, it places the auto advertising budget as contested between three groups: the auto verticals themselves, the general portals and social platforms (Sina/Weibo, Sohu), and the short-video and super-app ecosystems. Autohome does not size any of these positions or claim a share number, and its inclusion of a competitor says nothing about how much of an OEM's budget that competitor actually wins.
With respect to our auto media and leads generation businesses, we face competition from mainland China’s automotive vertical websites and mobile applications, such as BitAuto, Dongchedi, Xcar and PCauto, from the automotive channels of major internet portals, such as Sina and Sohu, and from companies engaged in mobile social media, news, video and live-streaming applications. […] In addition, we also face competition from companies engaged in social media business, such as ByteDance and Tencent, companies engaged in data product offering, such as BitAuto and Dongchedi, and companies engaged in AI and big data technologies.
p. 137 · Read in context →
The auto advertising recession, as Autohome reports it in the MD&A of its FY2025 20-F. Media services - the line that is substantially automaker brand advertising and regional campaigns - fell 24.3% to RMB1,153.4 million (US$164.9 million), and Autohome attributes it entirely to demand, not competition: 'reduced advertising spending by ICE automakers amid shrinking sales volumes in the ICE segment.' The three-year path in the same filing is RMB1,870.8m (2023), RMB1,523.1m (2024), RMB1,153.4m (2025), a 38% decline, over a period when the number of automakers buying media services barely moved (96, 101, 96) and the top five stayed near a quarter of the line at 24.1%. Leads generation, the dealer-funded performance line, fell 13.6% alongside it. Weibo does not disclose revenue by vertical, so this cannot be mapped onto its accounts directly; what it establishes is that the auto brand-advertising pool one of Weibo's named competitor categories sells into contracted sharply in 2025 for reasons outside any platform's control.
Our net revenues decreased by 8.3% from RMB7,039.6 million in 2024 to RMB6,452.0 million (US$922.6 million) in 2025.
Media services. Our media services revenues decreased by 24.3% from RMB1,523.1 million in 2024 to RMB1,153.4 million (US$164.9 million) in 2025. The decrease in revenues from our media services was primarily due to reduced advertising spending by ICE automakers amid shrinking sales volumes in the ICE segment.
Leads generation services. Leads generation services revenues decreased by 13.6% from RMB3,135.9 million in 2024 to RMB2,709.2 million (US$387.4 million) in 2025.
p. 202 · Read in context →
Autohome's CFO answering an analyst on the outlook for the traditional media and leads businesses, Q3 FY2025 call. The transmission mechanism is stated plainly: OEM promotional discounts running above 23% mean automakers are spending on price rather than on media, and management expected that to keep pressuring media services revenue into the December quarter. On the same call Autohome added that more than half of dealers were operating at a loss in the first half of 2025, and on the Q4 call in March 2026 it put the auto sector's profit margin at 4.1%, down from 4.3%. The passage is a transcript from a third-party provider and reads roughly in places ('So, the price significantly' is an evident gap); the numbers, however, are consistent with the 24.3% media services decline reported in the 20-F. It is management's read of its own customers' budgets, not an industry survey.
Xiaodan Zhang (CICC) and Craig Yan Zeng (Chief Financial Officer), interpreted: Xiaodan Zhang: [Interpreted] So can management share your outlook on the traditional business for the upcoming quarters? And also, is there any update on the shareholder return plans?
Yan Zeng: [Interpreted] Thank you for your question. In the third quarter, we do see that the OEM promotional discount still remains at high level and the price war has been there for so long. And the overall discount for OEMs has already exceeding 23%. So, for the car sales volume and profit, I still remain concentrated among the leading companies. So, the price significantly. And the continued decline is mainly due to the continued pressure from the OEMs price war in the market. And as Q4 approaches to the year-end, and we believe OEMs is expected to maintain high professional discounts to boost their sales revenues and this still put pressure on our media services revenue.
p. 9 · Read in context →
iQIYI, Inc. (IQ)
The largest single competitor for Chinese brand advertising in this file, and the platform whose content drives much of what Weibo's users talk about. iQIYI booked RMB5,193.4 million (US$742.6 million) of online advertising in 2025 - roughly half of Weibo's advertising revenue - and sells it against dramas, variety shows and, increasingly, micro dramas, competing with Weibo for the entertainment, FMCG, internet-services and e-commerce budgets that both platforms count as core. The competitive relationship runs two ways: iQIYI's risk factors name 'internet social platforms' and 'short video platforms' among the services it competes with for user traffic and advertising customers, while Weibo's celebrity and drama verticals are commercially dependent on the content iQIYI and its rivals commission. iQIYI's 2025 was a down year on both lines that matter - advertising down 9.1%, membership down 5.4% - and it attributes the advertising decline to advertisers adjusting strategy 'in response to macro pressure,' which is the same demand backdrop Weibo has been operating in. Its Q4 commentary on which verticals actually grew is the closest thing here to a category-level read on Chinese brand budgets.
iQIYI's competition risk factor from its FY2025 Form 20-F. Notable for what it puts in the competitive set: alongside other long-form video services, iQIYI lists 'micro drama platforms, internet social platforms and short video platforms, as well as major TV stations' as rivals for content, user traffic and advertising customers. 'Internet social platforms' is the category Weibo sits in, and the framing is symmetrical with Weibo's own filing, which lists multimedia content platforms and online media platforms among its competitors. The last sentence is the more useful disclosure for sizing purposes: iQIYI's stated view is that most large mainland advertisers still direct a significant share of budget to traditional television, which if true means the online brand pool both companies fish in is smaller than total advertising spend implies. iQIYI offers no figures for any of this - it is a risk-factor characterisation, and the typography ('wil likely') is as filed.
We face competition for content production, content sourcing, user traffic and advertising customers from other providers of online entertainment video services primarily in Chinese mainland. We also compete with other internet media and entertainment services, such as micro drama platforms, internet social platforms and short video platforms, as well as major TV stations. Some of our competitors have a longer operating history and significantly greater financial resources than we do, and, in turn, may be able to attract and retain more users, usage time and advertising customers. In particular, most large companies in Chinese mainland allocate, and wil likely continue to allocate, a significant portion of their advertising budgets to traditional media such as major TV stations.
p. 49 · Read in context →
iQIYI's 2025 revenue bridge from the MD&A of its FY2025 20-F. Online advertising fell 9.1% to RMB5,193.4 million (US$742.6 million), attributed to advertisers adjusting spending 'in response to macro pressure'; membership fell 5.4%, attributed partly to 'the competition among online entertainment video service providers.' The advertising line is about half the size of Weibo's US$1,501.6 million and moving down, which frames Weibo's flat advertising result differently than a standalone reading would: the largest long-form video seller of brand advertising in this peer set lost ground in the same year. The membership explanation is worth separating out - that decline is a fight among Tencent Video, Youku, Mango and iQIYI over subscription share, not something Weibo participates in. Both attributions are management's, given in a filing with an obvious interest in ascribing weakness to the market rather than to itself.
Our revenues decreased by 6.6% from RMB29,225.2 million in 2024 to RMB27,291.3 million (US$3,902.6 million) in 2025.
Membership services. Our membership services revenue decreased by 5.4% from RMB17,762.8 million in 2024 to RMB16,807.3 million (US$2,403.4 million) in 2025, primarily due to a lighter content slate and the competition among online entertainment video service providers.
Online advertising services. Our online advertising services revenue decreased by 9.1% from RMB5,714.2 million in 2024 to RMB5,193.4 million (US$742.6 million) in 2025, as some advertisers adjusted their advertising and promotion strategies in response to macro pressure
p. 191 · Read in context →
iQIYI's category-level read on the December 2025 quarter, from the Q4 FY2025 call held 26 February 2026. Brand advertising returned to annual and sequential growth, with food and beverage, internet services, e-commerce and telecom services each up double digits, and commercial (performance) advertising recovering sequentially on the back of small and mid-sized advertisers. Those four verticals overlap with Weibo's key accounts, so the exhibit reads as evidence that the brand pool stabilised late in the year even though iQIYI's full-year advertising still fell 9.1% - the recovery is a fourth-quarter phenomenon on a weak base. The micro-drama point is the forward-looking one: iQIYI says brands are now buying product placement and theatre branding inside micro dramas, a format that did not exist as an ad channel two years ago and that competes for the same short-attention budgets Weibo sells. No revenue figures are attached to any of these claims on the call.
iQIYI management, prepared remarks (as transcribed): Moving on to advertising business. In Q4, brand advertising revenue growth both annually and sequentially, ad revenues from variety shows and our dramas both delivered double-digit annual growth, while core ad verticals such as food and beverage, Internet services and e-commerce and telecom services all recorded double-digit annual growth. Beyond long-form videos, our micro dramas and micro variety shows are gaining considerable attention from brand advertisers. […] For commercial ads, we regained sequential revenue growth in Q4, driven by a healthier and more balanced advertiser portfolio. Revenue from small and midsized advertisers grew both annually and sequentially. By vertical, Internet services, e-commerce and financial services led growth.
p. 6 · Read in context →
Hello Group Inc. (Momo, Tantan) (MOMO)
The closest read available on Weibo's value-added services business, which is where Weibo's live streaming, membership and virtual-gifting revenue sits. Hello Group is the pure play: 98.5% of its RMB10,367.1 million (US$1,482.5 million) of 2025 revenue came from value-added services, essentially all of it virtual gifting and subscriptions across Momo, Tantan and its overseas apps - a business roughly 5.7x the size of Weibo's US$255.6 million VAS line and run with no meaningful advertising revenue to cushion it. It also competes with Weibo more directly than the size gap suggests: both are mobile social platforms monetising interest-based discovery and live audio/video interaction, and Hello Group's own competition disclosure frames the fight as one for 'a larger share of marketing budgets' against rivals with broader product ranges. What makes it worth reading is that its domestic numbers are deteriorating in the open - Momo paying users have fallen from 7.4 million to 3.9 million in two years and mainland revenue from RMB11.2 billion to RMB8.4 billion - giving an unusually explicit account of what has happened to the Chinese virtual-gifting economy that Weibo's VAS line also depends on.
Hello Group's headline operating and revenue disclosure from its FY2025 Form 20-F. Momo app paying users of 7.4 million (Q4 2023), 5.7 million (Q4 2024) and 3.9 million (Q4 2025) - a 47% decline in two years - alongside group revenue falling from RMB12,002.3 million to RMB10,367.1 million and net income from RMB1,951.7 million to RMB806.5 million. Management attributes the paying-user decline to a deliberate cull of negative-ROI low spenders rather than to demand, a framing that has to be weighed against the fact that revenue and profit fell with it. For Weibo the relevance is directional: value-added services are 98.5% of Hello Group's revenue against roughly 15% of Weibo's (US$255.6 million of US$1,757.2 million in 2025), so this is the same virtual-gifting and membership economy observed at much higher magnification, and it has been contracting for three years.
We seek to improve profitability of our Momo business and we monitor the number and spending of Momo paying users as an indicator of our performance. The numbers of paying users of our Momo app were 7.4 million for the fourth quarter of 2023, 5.7 million for the fourth quarter of 2024 and 3.9 million for the fourth quarter of 2025. The decrease in Momo’s paying users in 2025 was primarily due to our strategic emphasis on profitability. This strategic focus resulted in a reduction in the acquisition of low-paying users with negative ROI, which is conducive to enhancing profitability. […] We recorded revenues of RMB12,002.3 million in 2023, RMB10,563.0 million in 2024 and RMB10,367.1 million (US$1,482.5 million) in 2025. We currently generate our revenues from value-added services and other services. Value-added service revenues mainly include virtual gift revenues from various audio, video and text-based scenarios, and membership subscription revenues. Value-added services represented 98.5%, 98.6% and 98.5% of our net revenues in 2023, 2024 and 2025, respectively. We had a net income of RMB1,951.7 million in 2023, RMB1,039.6 million in 2024 and RMB806.5 million (US$115.3 million) in 2025
p. 63 · Read in context →
The same decline broken into its parts, from Hello Group's FY2025 MD&A. Group revenue fell because mainland China fell - RMB11,204.0 million in 2023 to RMB8,367.1 million in 2025 on the geographic table on the same page, with overseas rising from 6.7% to 19.3% of the total and offsetting most of the domestic loss. The value-added services explanation names three causes: 'external factors that influenced the operational focus of certain broadcasters and agencies' (the standard formulation for regulatory tightening on live streaming and talent agencies), weak consumer sentiment, and Tantan's shrinking user base. Weibo's VAS revenue was flat at US$255.6 million in 2025 against US$256.0 million in 2024, so it has not seen the same fall - but the two businesses draw on the same pool of Chinese users willing to pay for virtual gifts and memberships, and Hello Group's answer to the domestic squeeze has been to move offshore, an option Weibo has not pursued.
Net revenues decreased from RMB12,002.3 million in 2023 to RMB10,563.0 million in 2024, and decreased to RMB10,367.1 million (US$1,482.5 million) in 2025, primarily due to declines in net revenues from Chinese mainland, including Momo app and Tantan app. The declines were largely offset by growth in net revenues from audio-and video-based products in the Middle East and North Africa region, primarily by new apps, along with incremental revenue from dating brands outside of Middle East and North Africa region. […] 2025 compared to 2024. Revenues from our value-added service decreased by 1.9% to RMB10,213.7 million (US$1,460.5 million) in 2025 from RMB10,415.6 million in 2024, primarily due to external factors that influenced the operational focus of certain broadcasters and agencies as well as the weak consumer sentiment on Momo app, and to a lesser extent, the decline in Tantan resulting from a decline in user base.
p. 99 · Read in context →
Hello Group's competition risk factor, FY2025 20-F. It describes the market as fragmented and highly competitive, and frames the disadvantage in terms Weibo shareholders will recognise: competitors with more cash, traffic and broadcaster relationships, and 'broader product or service offerings' that let them 'leverage their relationships based on other products or services to gain a larger share of marketing budgets.' That is the standard mid-cap Chinese internet complaint about competing with Tencent, ByteDance and Alibaba ecosystems, and it applies with equal force to Weibo, which makes the same argument in its own filing. No competitor is named and no share figure is given - this is a generic risk disclosure, included because it is the clearest statement in Hello Group's filings of who it believes it is losing budget to and why.
As a social networking platform that provides multiple services, including value-added service, mobile marketing services and other services, we are subject to intense competition from providers of similar services, as well as potential new types of online services. Our competitors may have substantially more cash, traffic, technical, broadcasters, business networks and other resources, as well as broader product or service offerings and can leverage their relationships based on other products or services to gain a larger share of marketing budgets. We may be unable to compete successfull against these competitors or new market entrants, which may adversely affect our business and financial performance.
p. 32 · Read in context →
More peer documents
Bilibili Inc. - Q1 FY2026 earnings call transcript — Q1 FY2026 · 21 pages · The most recent peer datapoint in the file and the one that extends the advertising trend past the FY2025 20-Fs: pp.9-11 carry COO Ni Li's answer to a JPMorgan question - advertising revenue RMB2.6bn, up 30%, described as the thirteenth consecutive quarter of double-digit growth, AI advertiser budgets up over 170%, automotive and digital products/home appliances each up over 30%, automated ad spend penetration at 85%, and an explicit statement of intent to 'expand our market share in our core verticals such as games, e-commerce and education.' · Open →
Bilibili Inc. - Q3 FY2025 earnings call transcript — Q3 FY2025 · 24 pages · p.4 is the single best vertical-level collision in the file: Bilibili reports automobile watch time up nearly 20% and auto ad spending up 35% in the September 2025 quarter - the same quarter Autohome's media services line was falling - plus AI advertiser revenue up around 90%. p.5 adds a 16% year-on-year increase in the number of advertisers, which is the advertiser-count metric Weibo stopped emphasising. · Open →
Bilibili Inc. - FY2025 Form 20-F — FY2025 · 256 pages · pp.129-130 print the eight-quarter tables of average DAUs, MAUs, monthly paying users and ARPPU - the cleanest quarterly series in this peer set for benchmarking Weibo's user trajectory. p.87 sets out the commercialisation model with 25.3 million premium members and the note that the top ten creators and hosts are under 1% of revenue; p.92 is the competition section, which argues Bilibili's full-spectrum model is not directly comparable to any single rival. · Open →
Autohome Inc. - Q4 FY2025 earnings call transcript — Q4 FY2025 · 18 pages · p.4 gives December 2025 mobile DAUs of 77.51 million on QuestMobile data, flat year on year. p.8 has management's 2026 industry outlook - auto sector profit margin of 4.1%, down from 4.3%, and the claim that competition shifts 'from the price war to value war.' pp.9-10 answer an HSBC question on whether AI agents disintermediate auto vertical media, a threat that applies to any information platform, Weibo included. · Open →
iQIYI, Inc. - Q2 FY2025 earnings call transcript — Q2 FY2025 · 22 pages · pp.7-9 are the mid-year advertising picture before the Q4 recovery: brand ads leaning on premium variety shows, food and beverage and communication services recovering, education advertiser revenue doubling, and AI-generated video ads lifting click-through 20%. p.11 reports online advertising down 13% year on year as advertisers adjusted to macro pressure (note the transcript renders the RMB figure with a dollar sign - the 20-F is the reliable source for the level). · Open →
Hello Group Inc. - FY2024 Form 20-F — FY2024 · 198 pages · The prior-year baseline for the virtual-gifting decline, filed before Hello Group restated its revenue presentation to merge live video into value-added services in Q1 2025. Reading it against the FY2025 filing shows which part of the fall was live streaming and which was subscriptions - a split Weibo does not disclose for its own VAS line. · Open →
Source: S&P Capital IQ consensus via Xpressfeed · Generated 2026-08-10.
Consensus Tape
Weibo's consensus turned in the last three months, and it turned on profit rather than volume. FY2027 normalized EPS is -12.9% against its May snapshot and FY2028 is -12.8%, while revenue moved only -3.3% and -4.1%. The prints say the same thing: 4Q25 revenue beat by 6.5% while EPS missed by -20.8%, ending a six-quarter beat streak. Consensus now carries FY2026 gross margin at 73.3%, down from 77.0%.
FY2027 Revenue Consensus ($M)
Revenue, Change vs Three Months Ago
FY2027 Normalized EPS Consensus ($/sh)
EPS, Change vs Three Months Ago
Source: derived from vendor data.
The cut landed on earnings, not on revenue
Source: derived from vendor data.
The two lines have different shapes, and the difference is the point. Revenue estimates rose into the May snapshot and then gave it all back: across the full six months FY2027 revenue is actually +2.1% and FY2028 is -1.0%. EPS fell at every step — FY2027 from 1.74308 to 1.69559 to 1.47678, a cumulative -15.3%, and FY2028 -20.2%. A revenue line that ends roughly where it started against an earnings line down a sixth is a margin-driven downgrade, not a demand-driven one.
Two mechanical notes on how far this reads. The one-month and current snapshots are identical on all four series, so the entire cut landed between the May and July marks rather than in the last few weeks. And the feed carries momentum for FY2027 and FY2028 only — there is no comparable history for the current year, so the revision cycle is visible on the outer years alone.
Revenue still beats; the EPS beat streak broke in 4Q25
Source: derived from vendor data.
Read together, the two records separate cleanly. Revenue has landed at or above consensus in seven of the last eight quarters and the single exception, 2Q24, missed by -0.0229% — an in-line print, not a shortfall. EPS was the same story only louder, with six consecutive beats averaging well into double digits and a +26.2154% peak in 2Q25, until 4Q25 came in at 0.25 against a 0.31559 consensus for a -20.7833% miss and 1Q26 followed at 0.34 against 0.36.
The signature matters more than either number. In 4Q25 revenue beat by +6.5234% and EPS missed by -20.7833% in the same print. Guidance that had been reliably conservative on profit stopped being conservative while the top line kept clearing — which is what a cost or mix problem looks like from the outside, and it is what the estimate cuts of the following months then priced in.
FY2026 is a reset year: revenue +2.6%, EBITDA -10.0%, free cash flow -30.6%
Source: derived from vendor data. FY2025 revenue and EBITDA are reported actuals; later years are consensus.
Revenue never breaks stride — +2.6% in FY2026, then +2.1% and +1.8% — but everything below it steps down and takes years to climb back. Against the FY2025 actuals, consensus has EBITDA -10.0%, GAAP net income -33.5%, operating cash flow -25.8% and free cash flow -30.6% in FY2026. EBITDA does not regain its FY2025 level until FY2028, and normalized EPS falls -13.8% to 1.42249 before recovering +3.8% and +4.5%. The dividend line moves with it: consensus DPS drops -30.8% to 0.55709 in FY2026 and is still below the FY2025 mark of 0.80525 by FY2029.
Source: derived from vendor data.
Gross margin steps down from 77.0% to 73.3%, and ROE from 12.9% to 8.8%
Source: derived from vendor data.
This is the line the EPS cuts are really about. Consensus gross margin drops from 77.00016% in FY2025 to 73.30042% in FY2026 and never returns — 73.81951% and 74.20411% in the two years after. Return on equity does the same thing more sharply, from 12.91003% to 8.81497%, and then keeps drifting down to 8.60193% by FY2029 even as revenue and EBITDA grow. Neither series carries an analyst count in the feed, so treat both as a thinner claim than the revenue and EPS lines above; the driver-level work behind them sits on the broker-model tab.
Quarterly consensus has revenue back near 481 million dollars by 4Q26 with EPS still around 0.35
Source: derived from vendor data. 4Q25 and 1Q26 are reported actuals; the remaining quarters are consensus.
The forward quarters restate the annual picture in miniature. Revenue is modelled to climb from 421.325 in 1Q26 to 481.39853 in 4Q26 — a level barely above the 473.258 Weibo actually printed in 4Q25 — while normalized EPS sits at 0.36206, 0.35286 and 0.34894, edging down across a rising top line. Quarterly gross margin carries the same shape, 71.62102% in 2Q26 against 78.97479% in 4Q24. Coverage here is thin and thinning: seven analysts on 2Q26 revenue, five on 3Q26 and four on 4Q26.
The street agrees on revenue and splits on earnings
Source: derived from vendor data.
On seventeen analysts, FY2027 revenue estimates run from 1733.84262 to 1919 — a band of roughly a tenth around the mean, and FY2026 is tighter still at 1759.83365 to 1833 with a standard deviation of 21.58259. Earnings are a different argument. On fifteen analysts, FY2027 normalized EPS spans 1.13 to 1.78182, and FY2028 spans 1.15 to 1.8648 on ten. The high FY2028 estimate is more than half again the low one, on a revenue base the same analysts price within a few percent of each other. That is disagreement about margin and cost, not about the size of the business.
FY2029 is the sharpest case — one analyst, so the low, mean and high are the same number on every metric, and the +8.9% revenue step it implies has nothing behind it to test. FY2028 is better but not deep: eleven on revenue, ten on EPS, seven on EBITDA and seven on GAAP net income.
Sixteen price targets from 6.60 to 11.10 dollars, and a book split down the middle
Source: derived from vendor data.
Target Price, Low ($)
Target Price, Median ($)
Target Price, Mean ($)
Target Price, High ($)
Source: derived from vendor data.
The book is close to evenly divided: six buys and two outperforms against seven holds, one underperform and one sell. Target prices are correspondingly unheroic — sixteen of them, low 6.6, high 11.1, and a mean of 9.03812 essentially on top of the 9 median, so the distribution is symmetric rather than dragged by an outlier. The high-to-low span is under two times, which is narrow for a name whose FY2028 EPS estimates differ by more than half. This source carries no current share price, so none of it can be read as upside or downside.
Visible Alpha broker models via S&P Xpressfeed · 13 brokers · 382 line items · freshest revision 2026-06-05.
Cost Breaks Before Demand
The models describe a business with almost no top-line left: revenue grows under 3% in each forecast year, and the audience shrinks in every one. What actually moves is cost. Brokers lift cost of revenue 20.8% in FY-2026, cutting gross margin 3.6pt, and GAAP earnings halve on a non-operating swing they do not repeat. The cash pile keeps building regardless. Disagreement sits in cash flow and below-the-line items, not in revenue.
FY-2026 Revenue
FY-2026 Revenue Growth
FY-2026 Gross Margin
FY-2026 GAAP Diluted EPS
Source: derived from vendor data.
Cost, not demand, is what breaks in FY-2026
Source: derived from vendor data.
Gross margin is modeled down from 76.7% in FY-2025 to 73.0% in FY-2026 and stays there: 73.5% in both FY-2027 and FY-2028. The quarterly path shows this is not a single accounting quarter — margin falls in three consecutive quarters to 72.7% in 2QFY-2026 and only claws back to 74.7% by 2QFY-2027, still below where it started. Operating margin absorbs the same hit, 30.4% to 25.5%, with barely any recovery by FY-2028 at 26.6%.
Source: derived from vendor data.
The arithmetic is stark: revenue rises 2.9% in FY-2026 while cost of revenue rises 20.8%, so gross profit actually falls. Three years of modeled revenue growth — 2.9%, then 2.3%, then 1.9% — do not get gross profit back above the FY-2025 level until FY-2027. Whatever brokers are provisioning for on the cost line, they treat it as a permanent reset rather than a one-year charge.
GAAP earnings halve on a line brokers do not model as recurring
Source: derived from vendor data.
GAAP net income is modeled down 48.6% in FY-2026; the operating measure falls 17.3%. The gap is almost entirely below the operating line. Total non-operating income swings from $193.9M in FY-2025 to a $29.0M expense in FY-2026, with the company-specific interest and other income line collapsing from $172.1M to $0.9M. On the operating measure the FY-2026 setback is real but ordinary; on GAAP it looks like a halving.
Source: derived from vendor data.
GAAP diluted EPS is modeled at 1.02 in FY-2026 against 2.04 in FY-2025, and never regains the FY-2025 level inside the forecast horizon — 1.32 in FY-2028 is still a third below. The operating measure tells a flatter story: 1.73, then 1.42, 1.46, 1.51. Which number an investor anchors on decides whether this looks like an earnings collapse or a modest step down. The headline consensus itself is covered on the CapIQ tab.
The audience shrinks every year; monetization does all the work
Source: derived from vendor data.
Average MAU is modeled down 3.1% in FY-2026 and never recovers, sliding again in FY-2027 and FY-2028. Average DAU follows, down 2.6% in FY-2026 and flat thereafter. Net adds in MAU are negative in all three forecast years. This is a shrinking audience by consensus, not one bearish model dragging an average.
Source: derived from vendor data.
Every dollar of modeled growth comes from the user, not from more users. Ad revenue per DAU rises 7.9% in FY-2026 and keeps climbing to 6.38 by FY-2028; ad revenue per average MAU goes 2.51 to 2.86. Engagement is assumed stable — the active ratio sits at 0.44 in FY-2025 and 0.45 by FY-2028 — so the models are underwriting price and load, not usage. That is the fragile part of this forecast: if pricing does not hold, there is no volume to fall back on.
Advertising is the only line the models grow
Source: derived from vendor data.
Advertising and marketing is the large majority of revenue and supplies all of the growth: up 5.1% in FY-2026, then 2.0% and 1.8%. Value-added services is modeled flat to slightly down across the same three years, so the entire consolidated story is one line. Alibaba-related revenue is modeled to grow faster than the rest, up 6.1% in FY-2026, which quietly raises related-party concentration rather than reducing it.
The sub-splits inside value-added services carry so little agreement that they are not worth reading as forecasts. On game-related services one model carries more than twenty times another's FY-2025 figure, and data licensing spans a comparable range across five brokers. These are definitional disagreements about where revenue is classified, not views on the business.
Where the models actually disagree
Source: derived from vendor data.
The revenue debate is nearly settled: across 12 brokers the FY-2027 interquartile band is narrow against the size of the business, and both extremes are single models. The disagreement is all below the revenue line. On GAAP net income the lowest FY-2027 model sits at roughly half the median — a gap wider than the entire modeled growth of the business over three years. Free cash flow is worse.
Source: derived from vendor data.
Read the quartiles rather than the range. On revenue and operating income the interquartile band is tight and the extremes are single models. On free cash flow the whole distribution is wide: the lowest FY-2027 model carries under a fifth of the median's cash generation. The advertising revenue spread across 10 brokers is the one place where a genuine difference of top-line view is being expressed rather than a modelling convention.
The cash pile builds; the payout does not
FY-2028 Free Cash Flow
FY-2028 Net Debt
FY-2028 Net Debt / EBITDA
FY-2028 Dividends Paid
Source: derived from vendor data.
Net debt is negative in every modeled year and gets more so, taking net debt to EBITDA from -1.8x in FY-2025 to -3.3x in FY-2028 — a net cash position deepening rather than being spent. Dividends are modeled down 6.8% in FY-2026 and roughly flat after that, so the models assume the cash simply accumulates rather than being returned or deployed. For a business with no modeled growth, that is the most consequential assumption on the page.
What this coverage does not support
Several of the most interesting company-specific lines rest on one or two models and should not be read as consensus. Quarterly advertising revenue per customer is a single-broker line, as are total ad customers and SME customer counts; key-account and SME revenue splits carry three to four brokers against 12 on total revenue. The KPL and Jiamian revenue lines are one model each. Forward quarterly coverage also thins sharply — 1QFY-2027 and 2QFY-2027 revenue carry 5 brokers against 12 for the equivalent annual figure — so the quarterly path beyond FY-2026 is a small-sample view. The freshest revisions in this set date from June 2026, ahead of any subsequent reporting.
Headline P&L consensus, momentum and beat/miss live in the CapIQ tab.
Source: S&P Capital IQ transcripts via Xpressfeed · latest indexed call 2026-05-28 · generated 2026-08-10.
Latest call digest
Weibo Corporation, Q1 2026 Earnings Call, May 28, 2026 · 2026-05-28T11:00:00
Q1 2026 — call held May 28, 2026. Revenue was $421.3 million, up 6% (1% on a constant currency basis), with advertising and marketing revenue of $369.8 million, up 9% (3% constant currency). Non-GAAP operating income was $119.8 million, a 28% margin against 33% a year earlier, as total cost and expenses rose 13% on higher ad production and marketing spend. March MAUs slipped to 562 million while average DAUs edged up to 254 million. Value-added services fell 11% to $51.6 million on weaker game revenue, and no analyst asked about it.
Prepared remarks were built around progress. The information feed rework "began to make positive impacts in March," video playback time grew double digits year over year, intelligent search moved from single-turn summaries to multi-turn conversational answers, and AI companies became a new source of advertising budget alongside local services and automobiles. The CFO framed the quarter as continued transition with initial signs of stabilization, and flagged an MSCI ESG upgrade from BB to AA.
The Q&A was less comfortable. Asked directly for a Q2 advertising outlook, management described customer stress instead of giving a growth figure — auto clients seeing double-digit sales declines, handset makers squeezed by memory costs, e-commerce advertisers under profitability pressure — one quarter after having quantified Q1 as single-digit growth on the prior call. On AI advertising, management said AI-produced material already accounts for roughly 40% of consumption, but that adoption and public acceptance of AI-generated content are headwinds, so mass commercialization is on hold pending internal testing. The conversational search feature grew 100% in Q1 but sits on a base of about 1 million users. Management also disclosed in Q&A, not in prepared remarks, that lower handset shipments meant fewer pre-installs, contributing to the user decline. Only two analysts were taken before the operator closed the call for time; no forward revenue or margin guidance was given.
Participant coverage from the latest call.
| Group | Participants | Count |
|---|---|---|
| Management | Sandra Zhang — Investor Relations Officer, SINA Corporation; Gaofei Wang — CEO & Director, Weibo Corporation; Cao Fei — Chief Financial Officer, Weibo Corporation; Operator | 4 |
| Analysts | Thomas Chong — Equity Analyst, Jefferies LLC, Research Division; Jennifer Huang | 2 |
Curated latest-call exchanges; one row per analyst topic.
| Analyst | Firm | Topic | What changed in Q&A |
|---|---|---|---|
| Thomas Chong | Jefferies | Q2 advertising outlook, full-year ad strategy, and AI's contribution to monetization | Management gave no Q2 growth figure. Instead it recapped Q1 ad growth of 9% (3% in RMB terms) and walked through client-side pressure: auto sales down double digits, handset makers raising prices on memory costs, e-commerce advertisers facing profitability strain. The argument offered was that Weibo's budgets track new-product launch frequency rather than client sales, with the World Cup cited as a second-half FMCG opportunity. On AI, management said generated ad material reaches roughly 40% of consumption and eCPM in the feed grew double digits, but that KOL and public acceptance of AI-generated content remains a constraint and mass commercialization is deferred. |
| Jennifer Huang | UBS | User trajectory after the feed revamp, video strategy progress, and user-facing AI products | Management attributed the Q1 MAU and DAU decline to channel placement changes and to lower handset shipments reducing pre-installs, and noted user acquisition cost rose because AI app marketing bid up the channels. It acknowledged users are still adjusting to the new feed. On video, it pointed to double-digit year-over-year growth in time spent and an effort to recruit creators from outside the platform. On AI, it disclosed that the conversational search feature doubled in Q1 from a base of about 1 million users, and that a partnership with ByteDance and Qwen enables one-minute video generation for a limited set of certified creators. |
Theme tracker
Themes are curator-classified across supplied calls.
| Theme | Status | Quarters mentioned | Read-through |
|---|---|---|---|
| AI applied to search, ad creative and content production | persisted | Q2 2023, Q3 2023, Q4 2023, Q1 2024, Q2 2024, Q3 2024, Q4 2024, Q1 2025, Q2 2025, Q3 2025, Q4 2025, Q1 2026 | AI has been raised on every call in the supplied history and is now the default frame for both product and monetization commentary. The concrete evidence has moved from model filings and pilots toward measured ad-side use — AI-generated creatives were put at nearly 30% of consumption as of end-October 2025 and 40% in December 2025 — while the user-facing products remain explicitly pre-revenue. |
| Homepage information feed revamp from relationship-based to interest-based distribution | persisted | Q4 2024, Q1 2025, Q2 2025, Q3 2025, Q4 2025, Q1 2026 | Introduced as a 2025 plan on the Q4 2024 call and rolled out to nearly all users by late July 2025, this is the through-line of the last six calls. Management has consistently paired it with a caution that some user metrics will be volatile during the transition, and in Q1 2026 still described the feed as in an optimization stage. MAUs have declined from 591 million in March 2025 to 562 million in March 2026 across that window. |
| Intelligent search user-scale milestones | dropped | Q2 2024, Q3 2024, Q1 2025, Q2 2025, Q3 2025, Q4 2025 | Management disclosed a rising intelligent search MAU figure on six consecutive calls — over 10 million, over 20 million, over 30 million, over 50 million, over 70 million, over 80 million. The Q1 2026 call gives no such figure. The only user number offered for AI search that quarter is the roughly 1 million base for the new conversational feature, a different and much smaller metric. |
| Video as the primary driver of time spent and retention | emerged | Q3 2025, Q4 2025, Q1 2026 | Video was previously one item in a list of content investments. Since the feed revamp it has been elevated to a named strategic driver for 2026, with management arguing that recommendation-based distribution finally lets video reach users without a following relationship. Reported evidence so far is double-digit growth in playback-page time spent rather than a revenue contribution. |
| Online game advertising weakness | persisted | Q4 2024, Q1 2025, Q2 2025, Q3 2025, Q4 2025, Q1 2026 | Named as a drag on every call in this window, consistently attributed to the absence of blockbuster releases and budget contraction at the large publishers. It matters because it has been a persistent, unresolved offset to growth in e-commerce and automobiles rather than a one-quarter comparison issue. |
| Handset and 3C budgets driven by the subsidy and launch cycle | persisted | Q3 2024, Q4 2024, Q1 2025, Q2 2025, Q3 2025, Q4 2025, Q1 2026 | The explanation has rotated with the cycle: trade-in subsidies lifting the sector, then pull-forward creating tough comparisons, then subsidy withdrawal, and most recently rising chip and memory costs squeezing manufacturer profitability. The consistent point is that this vertical is policy- and launch-driven rather than demand-driven. |
| Margin compression from monetization and content investment | emerged | Q4 2025, Q1 2026 | Through 2024 and most of 2025 management framed cost discipline as the source of stable profitability. On the Q4 2025 call it introduced an explicit budget-capped investment programme in brand and celebrity marketing, and operating margin has since fallen to 21% in Q4 2025 and 28% in Q1 2026, from 30% and 33% in the year-earlier quarters. |
| Analyst questions on capital return | dropped | Q4 2023, Q4 2024 | Capital allocation was a full question on both of those annual-results calls. It has not been raised since, even though the FY2025 dividend was set at $0.61 per ADS and roughly $150 million against $0.82 per ADS and roughly $200 million for FY2024. The reduction went unexamined in Q&A. |
Guidance ledger
Quotes, calls, and speakers are source-verified; outcomes are curator-classified.
| Verbatim guidance | Call | Speaker | Curator outcome | Outcome note |
|---|---|---|---|---|
| “in Q1, in terms of the growth rate itself, we had a single-digit growth. We're going to have a single-digit growth versus the same period of last year” | Weibo Corporation, Q4 2025 Earnings Call, Mar 18, 2026 · 2026-03-18T11:00:00 | Gaofei Wang | kept | Q1 2026 advertising and marketing revenue was $369.8 million, an increase of 9% year over year, within the single-digit range indicated. |
| “we expect this initiative to gradually yield returns from the second half of 2026 onwards” | Weibo Corporation, Q4 2025 Earnings Call, Mar 18, 2026 · 2026-03-18T11:00:00 | Gaofei Wang | pending | Refers to the budget-capped brand and IP marketing investment programme. The Q1 2026 call reported encouraging results in pilot projects but no revenue attribution, and the promised period has not yet been reported. |
| “we expect that at the end of the year, maybe more than 10% of our brand customers can start to use the AI ad system” | Weibo Corporation, Q2 2025 Earnings Call, Aug 14, 2025 · 2025-08-14T11:00:00 | Gaofei Wang | unknown | No later call in the supplied history reports brand-advertiser adoption of the AI ad system. The Q4 2025 call gives AI-generated creatives as 40% of promoted feed and real-time bidding consumption, which is a different measure. |
| “The upgraded version is currently under internal test and is expected to open to users during the second quarter.” | Weibo Corporation, Q1 2025 Earnings Call, May 21, 2025 · 2025-05-21T11:00:00 | Gaofei Wang | missed | The Q2 2025 call stated the product and technical framework upgrade was completed in early July and rolled out to nearly all users then, just after the second quarter closed. |
| “The new version of Weibo intelligent search function powered by the latest open source model will be rolled out to all users this quarter.” | Weibo Corporation, Q4 2024 Earnings Call, Mar 13, 2025 · 2025-03-13T11:00:00 | Sandra Zhang | missed | Spoken by the interpreter for the CEO. The Q1 2025 call reported that the open source models were integrated into search in March but that the rollout to all users came in April, one month past the quarter indicated. |
| “We expect to see the handset return to growth trajectory in the fourth quarter with the event for new phone release schedule.” | Weibo Corporation, Q3 2024 Earnings Call, Nov 19, 2024 · 2024-11-19T11:00:00 | Sandra Zhang | kept | Spoken by the interpreter for the CEO. The Q4 2024 call reported that revenues from both the automobile and handset sectors delivered solid growth in the quarter. |
| “in Q4, we are expecting to see a year-on-year double digit growth” | Weibo Corporation, Q3 2024 Earnings Call, Nov 19, 2024 · 2024-11-19T11:00:00 | Gaofei Wang | unknown | Refers to the 3C and consumer electronics verticals benefiting from national subsidies. The Q4 2024 call described solid growth from these verticals but did not quantify it, so the double-digit claim cannot be checked. |
| “we expect that in Q4, the value-added services revenue will still keep a very high growth rate” | Weibo Corporation, Q3 2024 Earnings Call, Nov 19, 2024 · 2024-11-19T11:00:00 | Gaofei Wang | kept | Q4 2024 value-added services revenue was $71 million, an increase of 18% year over year. |
Q&A pressure map
Question counts and firms are curator tallies; analyst coverage shown above.
| Topic | Questions | Firms | Pressure / response |
|---|---|---|---|
| Advertising outlook by quarter and by vertical | 14 | Goldman Sachs, BofA Securities, UBS, Citigroup, Jefferies | Raised on all twelve calls in the supplied history, usually as the first question. Management answers this consistently and at length, but the disclosure has narrowed: on the Q4 2025 call it quantified the coming quarter as single-digit growth, while on the Q1 2026 call the same question drew vertical-by-vertical commentary and no growth figure for Q2. |
| AI strategy and what it actually contributes | 15 | Haitong International, Goldman Sachs, Jefferies, China International Capital Corporation, BofA Securities, Citigroup, UBS, CLSA | At least one AI question on every call since Q2 2023, and both questions on several recent calls. The line of questioning has shifted from capability to proof, and management has increasingly answered with measurable ad-side figures such as creative share of consumption and eCPM gains. |
| Commercialization of intelligent search | 3 | UBS, Goldman Sachs, CLSA | Asked in Q2 2025 twice and again in Q3 2025. Management deferred each time, saying there is no clear industry business model and that it is in no hurry on revenue. The CLSA question asked specifically whether commercialization attempts would happen in the fourth quarter; the answer described traffic benefits and advertiser content assets, and stated the capability is not directly charged for, without addressing the fourth-quarter timing. |
| User growth and the quality-over-scale strategy | 3 | BofA Securities, Haitong International, UBS | Pressed in Q2 2023, Q1 2024 and again in Q1 2026, with no dedicated question in between. That gap covers the whole feed revamp and the decline in reported MAUs from 591 million in March 2025 to 562 million in March 2026. |
| Capital allocation and shareholder returns | 2 | China International Capital Corporation, Haitong International | Asked only on the Q4 2023 and Q4 2024 annual-results calls. Neither the FY2025 dividend reduction nor the buyback option management said it was open to has been revisited in Q&A since. |
| Value-added services | 1 | Goldman Sachs | A single question, in Q3 2024, when the segment was growing 25%. The segment has since turned down, falling 11% year over year in Q1 2026, without drawing an analyst question. |
Language shifts
Only language evidence verified against the referenced component is shown.
| Observation | Verbatim evidence | Call ID | Component |
|---|---|---|---|
| Management moved from describing customer budgets in terms of market share and opportunity to describing customer distress directly, and did so in Q&A rather than prepared remarks. | “even if our ad revenue was growing, we have still a stressful operation for our customers” | 1997597258 | 5 |
| Margin language changed on the Q4 2025 call. After several years of framing stable profitability as the outcome of cost discipline, management pre-committed investors to short-term margin fluctuation, bounded by an ROI test and a budget cap. Operating margin then fell to 21% in Q4 2025 and 28% in Q1 2026. | “While there is a fluctuation in profit margin in the short term, the overall pacing will be strictly managed based on the ROI and kept within a controllable budget cap.” | 1984155766 | 2 |
| Confidence on the feed revamp has firmed from conditional to affirmative. In Q3 2025 management warned that the transition could hurt experience for some cohorts; in Q1 2026 it described early results as validating the direction, while still calling the feed an optimization stage. | “These preliminary results have boosted our confidence to further advance the optimization of information feed products.” | 1997597258 | 1 |
| The caution that appeared in Q3 2025 on the same subject, for comparison: the risk was stated plainly at the point of rollout rather than after the fact. | “In the short term, user experience for certain user group may face some challenges.” | 1968180258 | 2 |
| New risk vocabulary around AI content appeared in Q1 2026. Prior calls discussed AI creative purely as an efficiency and eCPM gain; this is the first time management named user acceptance as a limit on scaling it. | “we've been seeing some of the headwinds in terms of the adoption rate as well as the acceptance by the public in terms of those ad generated by AI” | 1997597258 | 5 |
| The Q4 2025 close was the most declarative revenue language in the history reviewed, and it stands in contrast to the absence of any full-year framing on the following call. | “Overall, Weibo has achieved its annual ad revenue target as we beef up organizational execution, AI-empowered capability in 2025.” | 1984155766 | 2 |
The call history reframes the debate from whether advertising has stabilized to what stabilization costs. Ad revenue returned to growth in Q1 2026, but the two quarters that produced it also carried the sharpest margin decline in the history reviewed, an MAU base that has fallen for four consecutive reported quarters, and a Q&A in which management declined to quantify the next quarter after having done so the quarter before. The AI story is measurable on the cost and creative side and still explicitly pre-revenue on the user side.